After the software components installation in the previous article
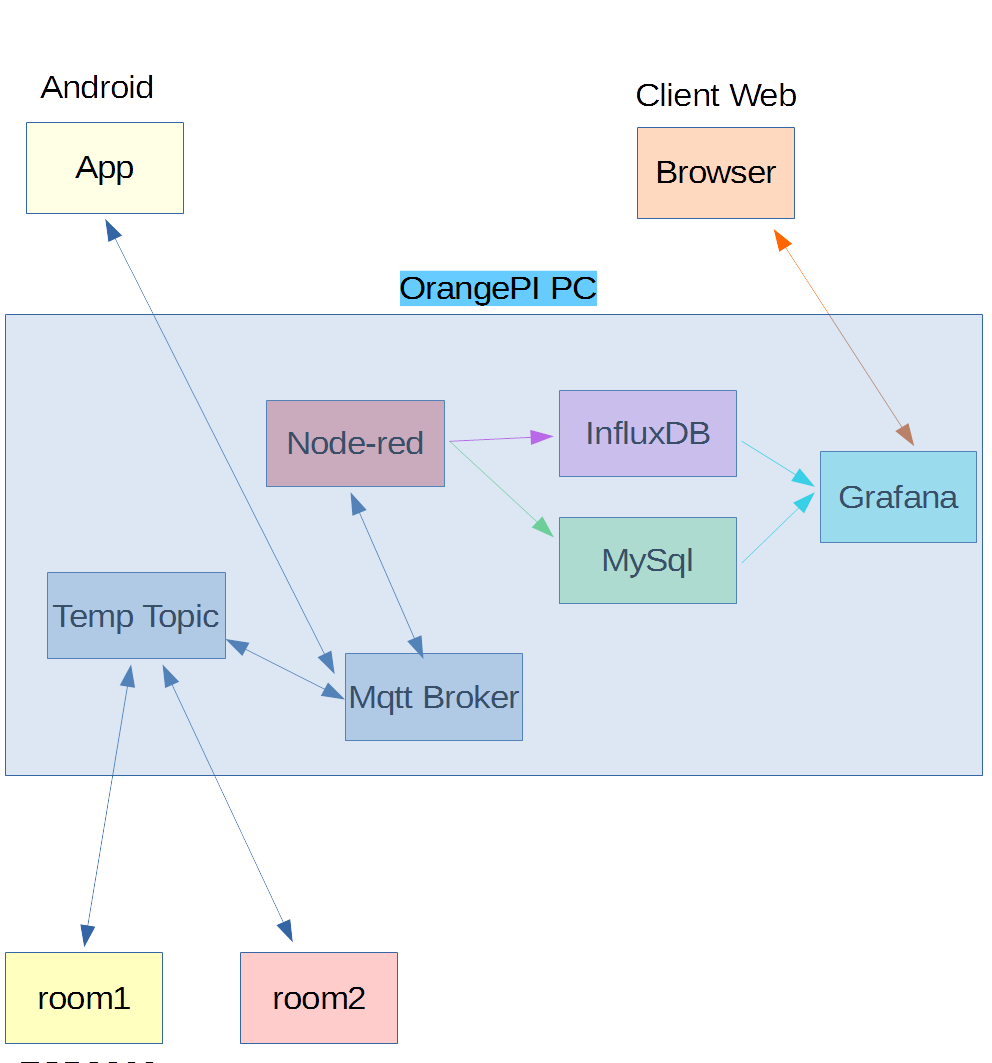
Sensors Monitoring – Eninronment Setup
we finish this operation with this article.
Infludb
The Influxdb is installed as indicated in the link
Influxdb
For Debian 9 we execute the following commands
|
|
curl -sL https://repos.influxdata.com/influxdb.key | sudo apt-key add - source /etc/os-release test $VERSION_ID = "9" && echo "deb https://repos.influxdata.com/debian stretch stable" | sudo tee /etc/apt/sources.list.d/influxdb.list sudo apt-get update sudo apt-get install influxdb sudo systemctl enable influxdb sudo systemctl start influxdb |
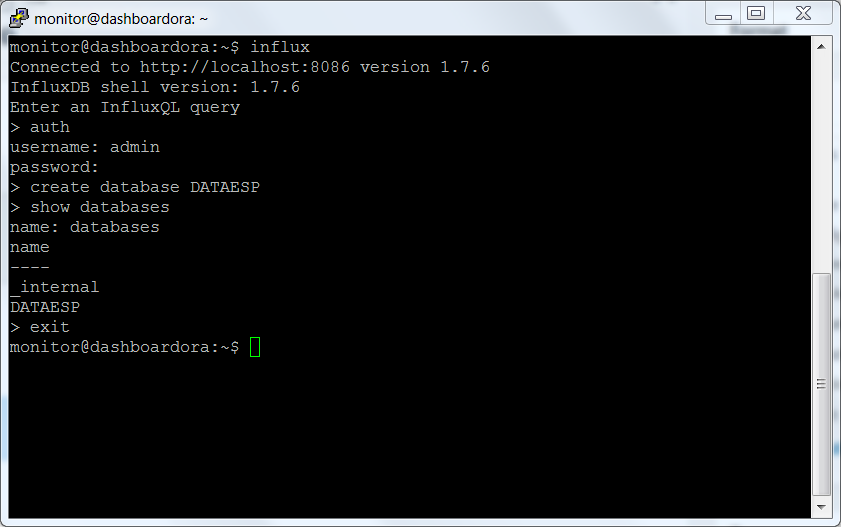
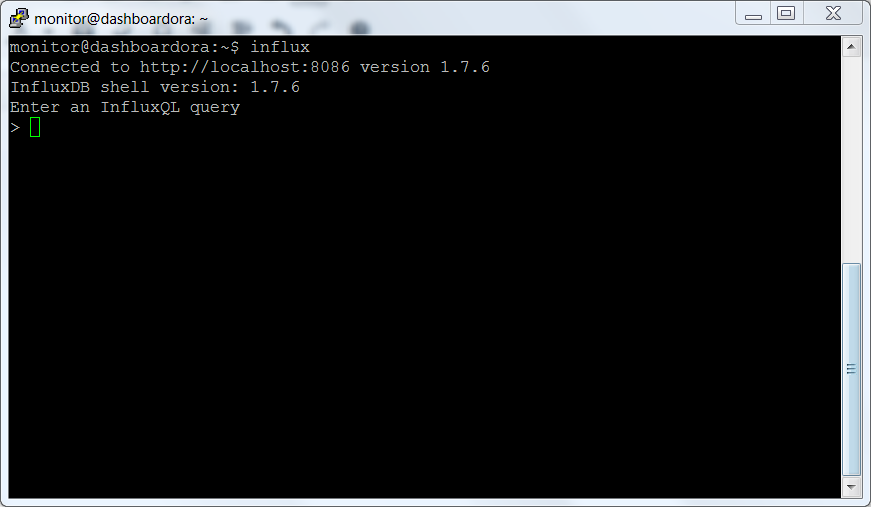
Check that everything works correctly by connecting with the infludb client
Nodered
We proceed to the installation of node.js
|
|
curl -sL https://deb.nodesource.com/setup_10.x | sudo bash - sudo apt-get install nodejs |
Then we proceed to nodered installation, as indicated at the link
Nodered installation
|
|
sudo npm install -g --unsafe-perm node-red |
To run nodered at the start up, we use the script available at the following link
Nodered autostart
We did not run the automated script, but executed the following steps
|
|
wget -O /tmp/download https://gist.github.com/bigmonkeyboy/9962293/download cd /tmp/ unzip download sudo cp /tmp/9962293-master/nodered /etc/init.d/ sudo chmod 755 /etc/init.d/nodered |
Edit /etc/init.d/nodered and change the user from pi to monitor, ie change the parameter
in
Run
|
|
sudo update-rc.d nodered defaults |
Start nodered
|
|
sudo systemctl start nodered sudo systemctl enable nodered |
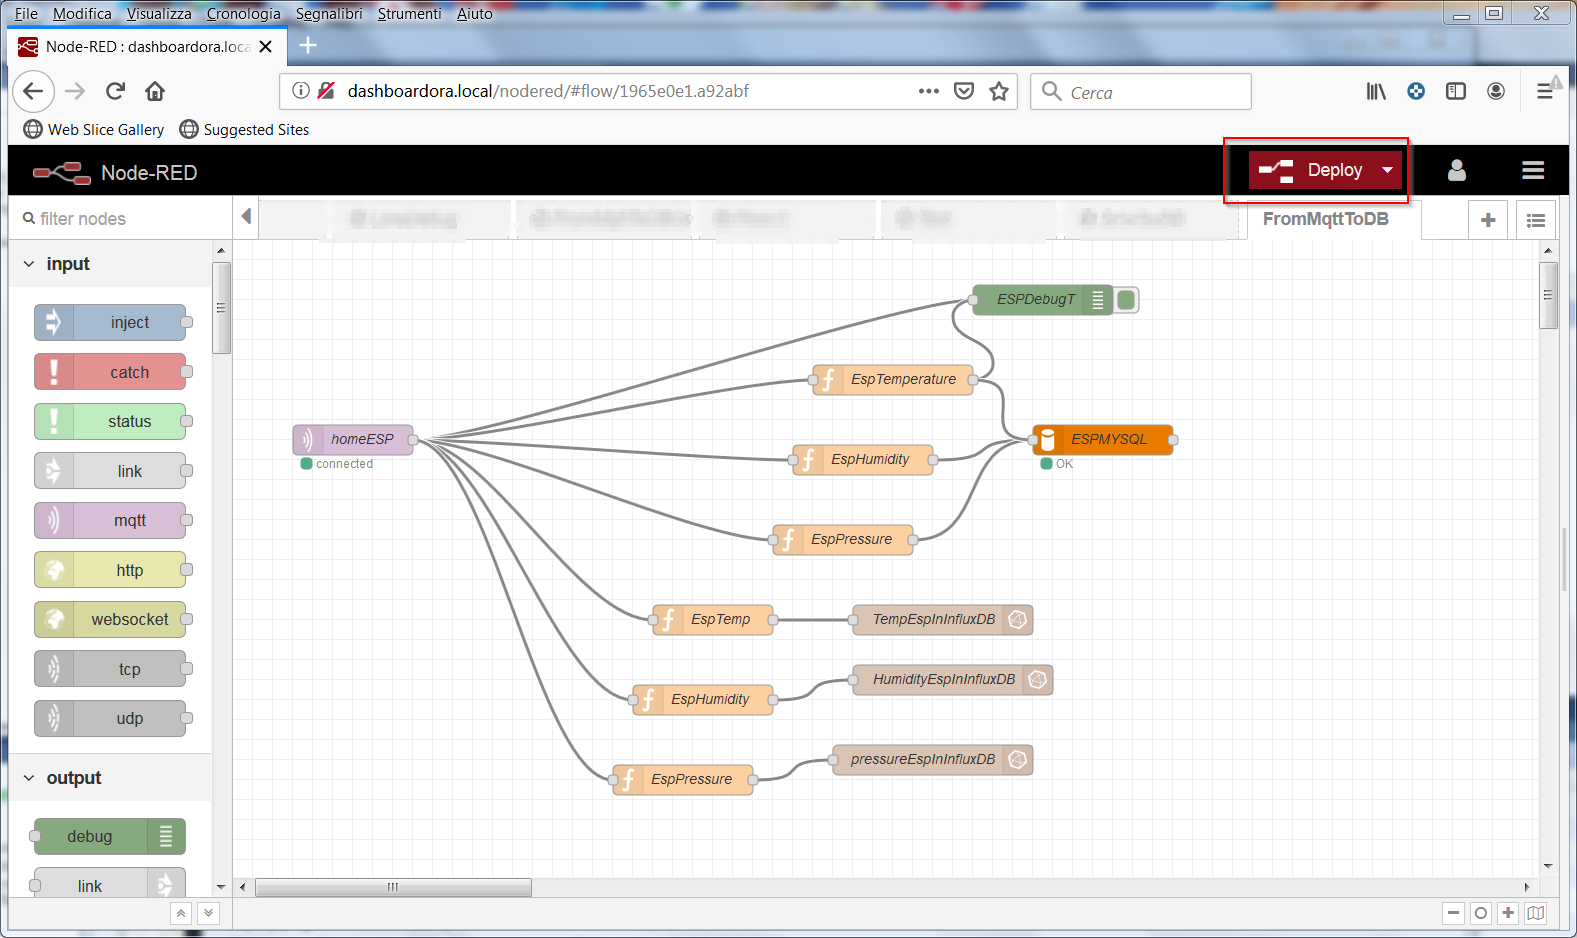
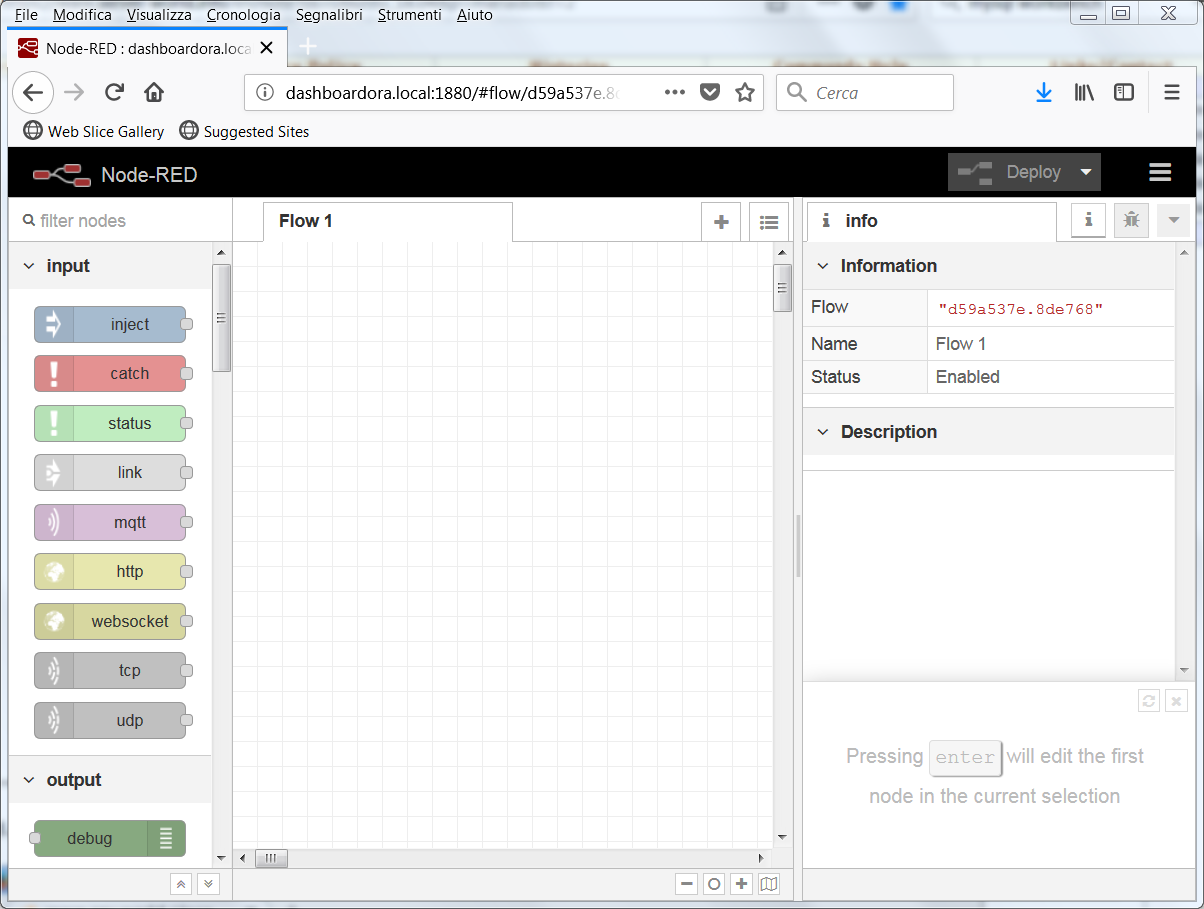
Check that nodered works by accessing the following link with the browser
http://dashboardora.local:1880
Restart the system and check that nodered starts automatically.
Proceed to the installation of the nodered add-ons
|
|
sudo npm install node-red-node-base64 -g sudo npm install node-red-node-mysql -g sudo npm install node-red-contrib-startup-trigger -g sudo npm install node-red-contrib-string -g sudo npm install node-red-node-base64 -g sudo npm install node-red-contrib-influxdb -g |
Grafana
We proceed to download the version for arm
Grafana for ARM
|
|
wget https://dl.grafana.com/oss/release/grafana_6.1.4_armhf.deb sudo dpkg -i grafana_6.1.4_armhf.deb |
Enable and start Grafana
|
|
sudo systemctl daemon-reload sudo systemctl enable grafana-server sudo systemctl start grafana-server |
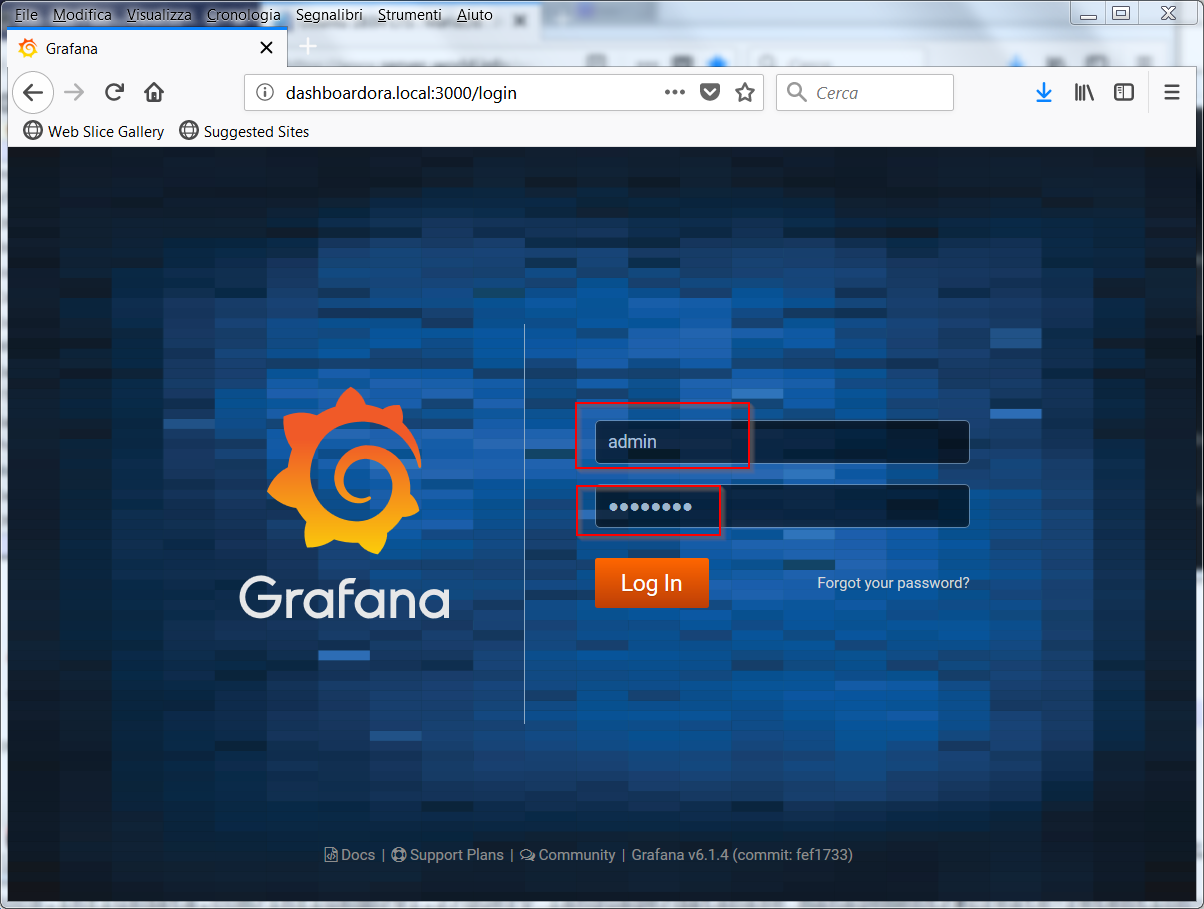
Access the system using the url
http://dashboardora.local:3000
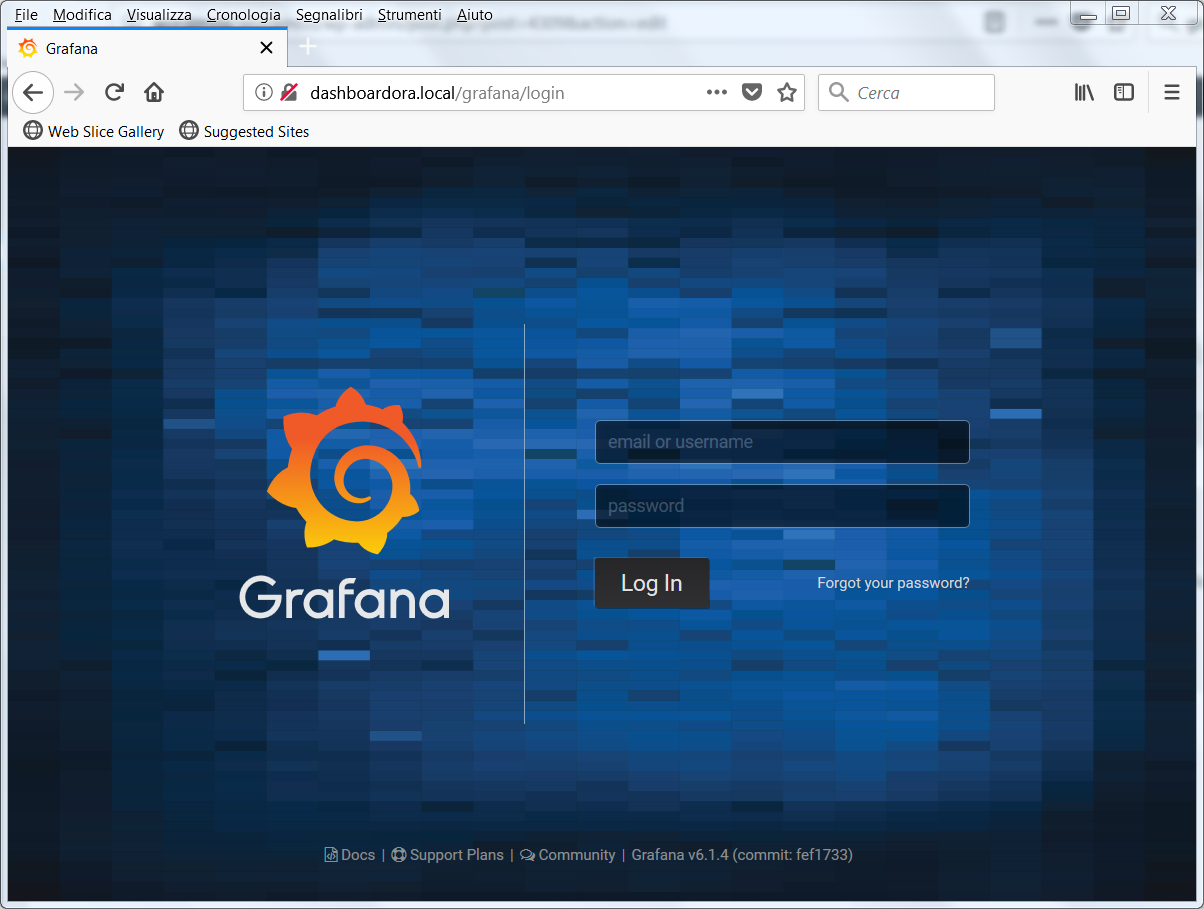
Log in with the user admin and password admin; change the password
 Once the new password has been set, the setup interface is available
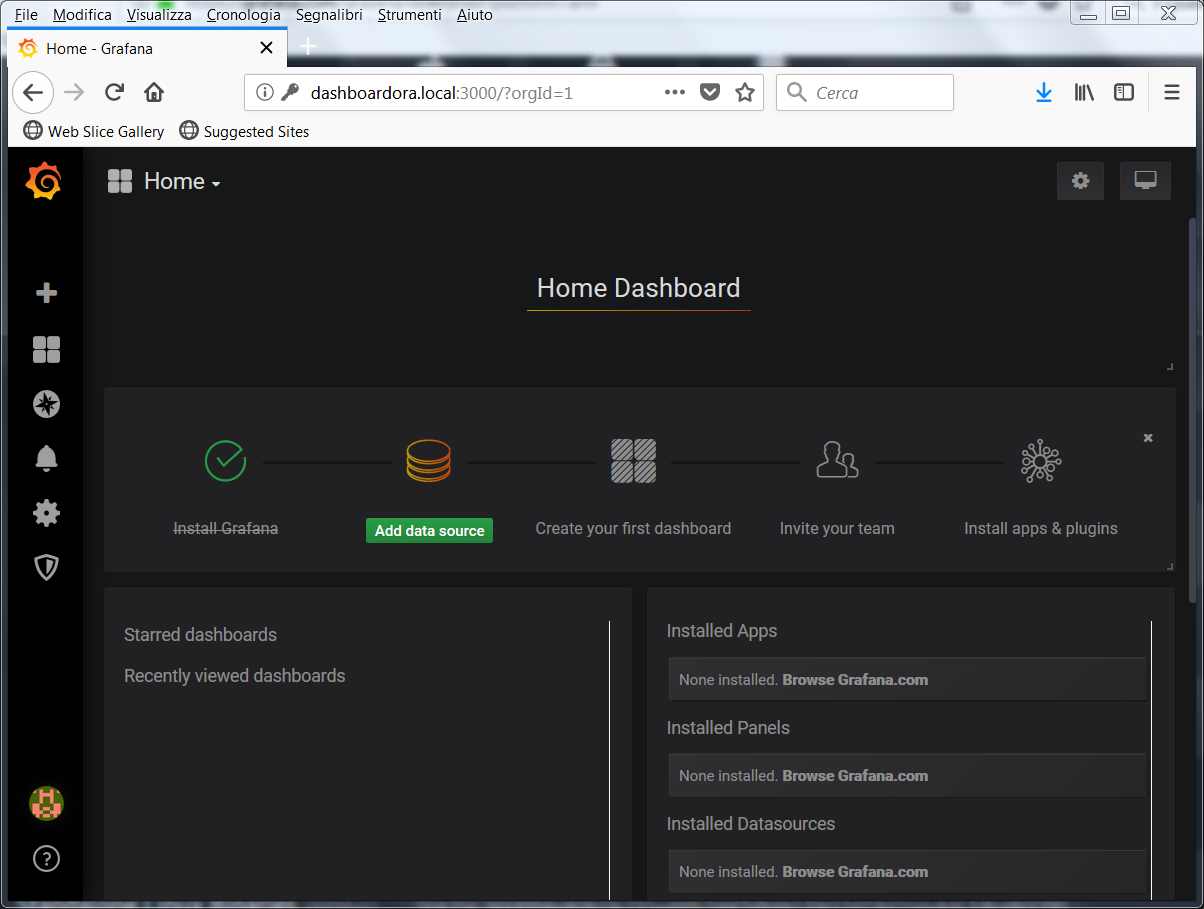 In the next articles we will execute the settings to be able to view the sensors data.
Reverse Proxy installation
To access the system through port 80 of the http server we use nginx as a reverse proxy
nginx
We disable apache
|
|
sudo systemctl stop apache2 sudo systemctl disable apache2 |
We proceed to the installation of nginx
|
|
sudo apt-get install nginx sudo systemctl start nginx sudo systemct enable nginx |
Everything must be configured to access the two systems using the following links
http://dashboardora.local/nodered for nodered
http://dashboardora.local/grafana for grafana
For Grafana we follow the official documentation
Grafana proxy
We change the file /etc/grafana/grafana.ini by modifying the domain and root_url parameters; in our file the parameteres are modified as follows
|
|
# The public facing domain name used to access grafana from a browser ;domain = localhost domain = dashboardora.local # Redirect to correct domain if host header does not match domain # Prevents DNS rebinding attacks ;enforce_domain = false # The full public facing url you use in browser, used for redirects and emails # If you use reverse proxy and sub path specify full url (with sub path) ;root_url = http://localhost:3000 root_url = %(protocol)s://%(domain)s/grafana/ |
Then we configure nginx, creating the servizi file with the following contents in the /etc/nginx/sites-available folder
1 2 3 4 5 6 7 8 9 10 11 12 13 14 15 16 17 18 19 20 21 22 23 24 25 26 27 |
server { listen 80; listen [::]:80 ipv6only=on; server_name dashboardora.local dashboardora; root /usr/share/nginx/www; index index.html index.htm; location /grafana/ { proxy_pass http://localhost:3000/; proxy_set_header Host $host; proxy_set_header X-Real-IP $remote_addr; proxy_set_header X-Forwarded-Host $host; proxy_set_header X-Forwarded-Server $host; proxy_set_header X-Forwarded-For $proxy_add_x_forwarded_for; } location /nodered/ { proxy_set_header Host $http_host; proxy_set_header X-Real-IP $remote_addr; proxy_set_header X-Forwarded-For $proxy_add_x_forwarded_for; proxy_set_header X-Forwarded-Proto $scheme; proxy_http_version 1.1; proxy_set_header Upgrade $http_upgrade; proxy_set_header Connection "upgrade"; proxy_pass http://localhost:1880/; } } |
Here is the link of the nginx configuration
nginx configuration
We run the following command
|
|
sudo ln -s /etc/nginx/sites-available/servizi /etc/nginx/sites-enabled/ |
and start nginx and grafana services
|
|
sudo systemctl restart grafana-server sudo systemctl restart nginx |
At this point it is possible to access the two services via the links
http://dashboardora.local/nodered

http://dashboardora.local/grafana
 In the next article we start the configuration of the various modules needed for the sensors monitoring
Sensors Monitoring – MySql Configuration
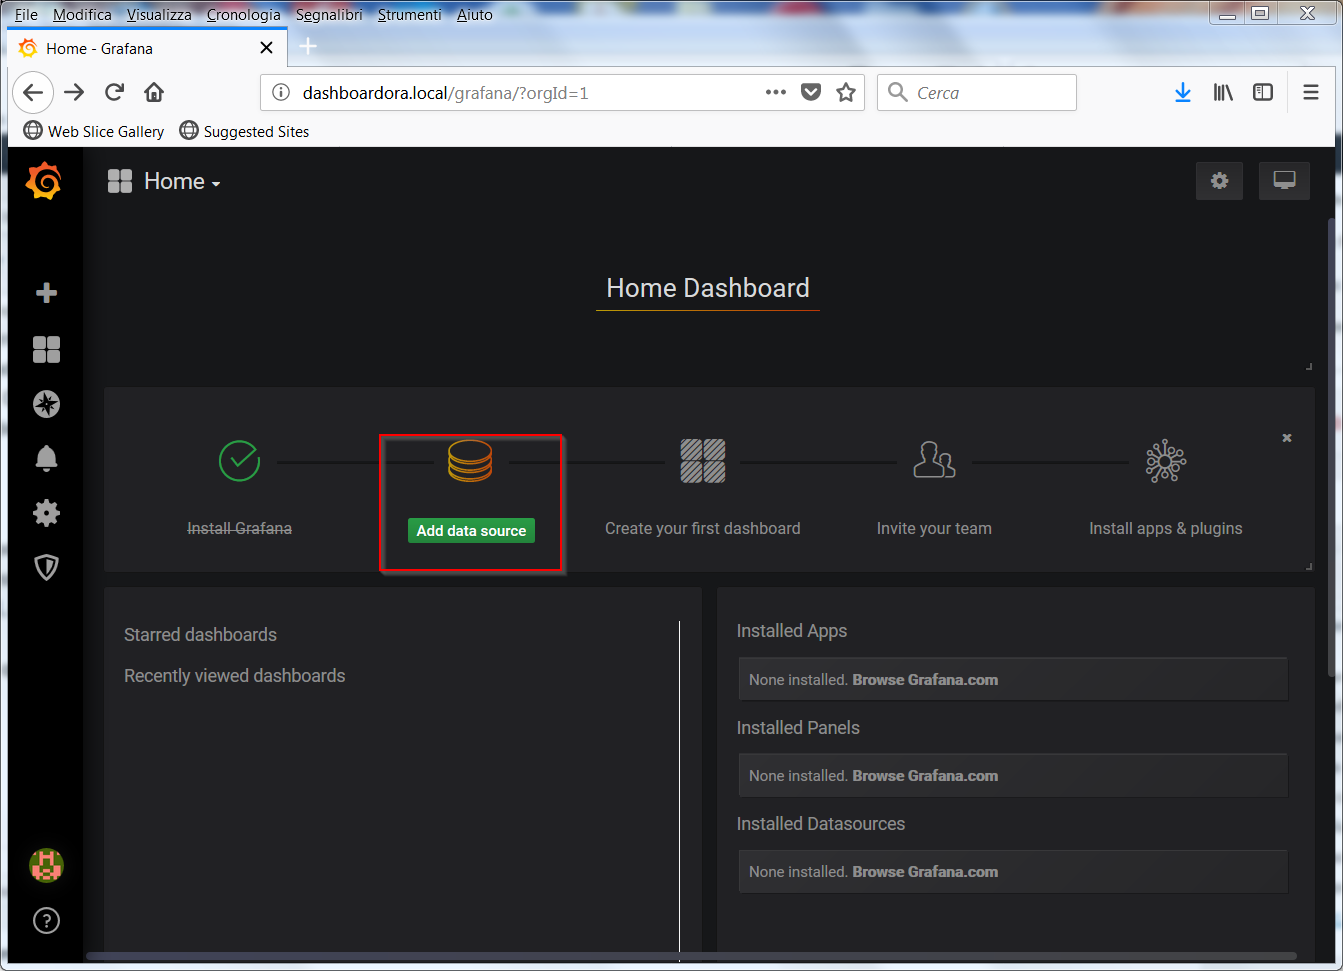 With Add data source you access the Data Source screen, from which you can choose InfluxDB and MySql
 Below the settings for InfluxDB and MySql
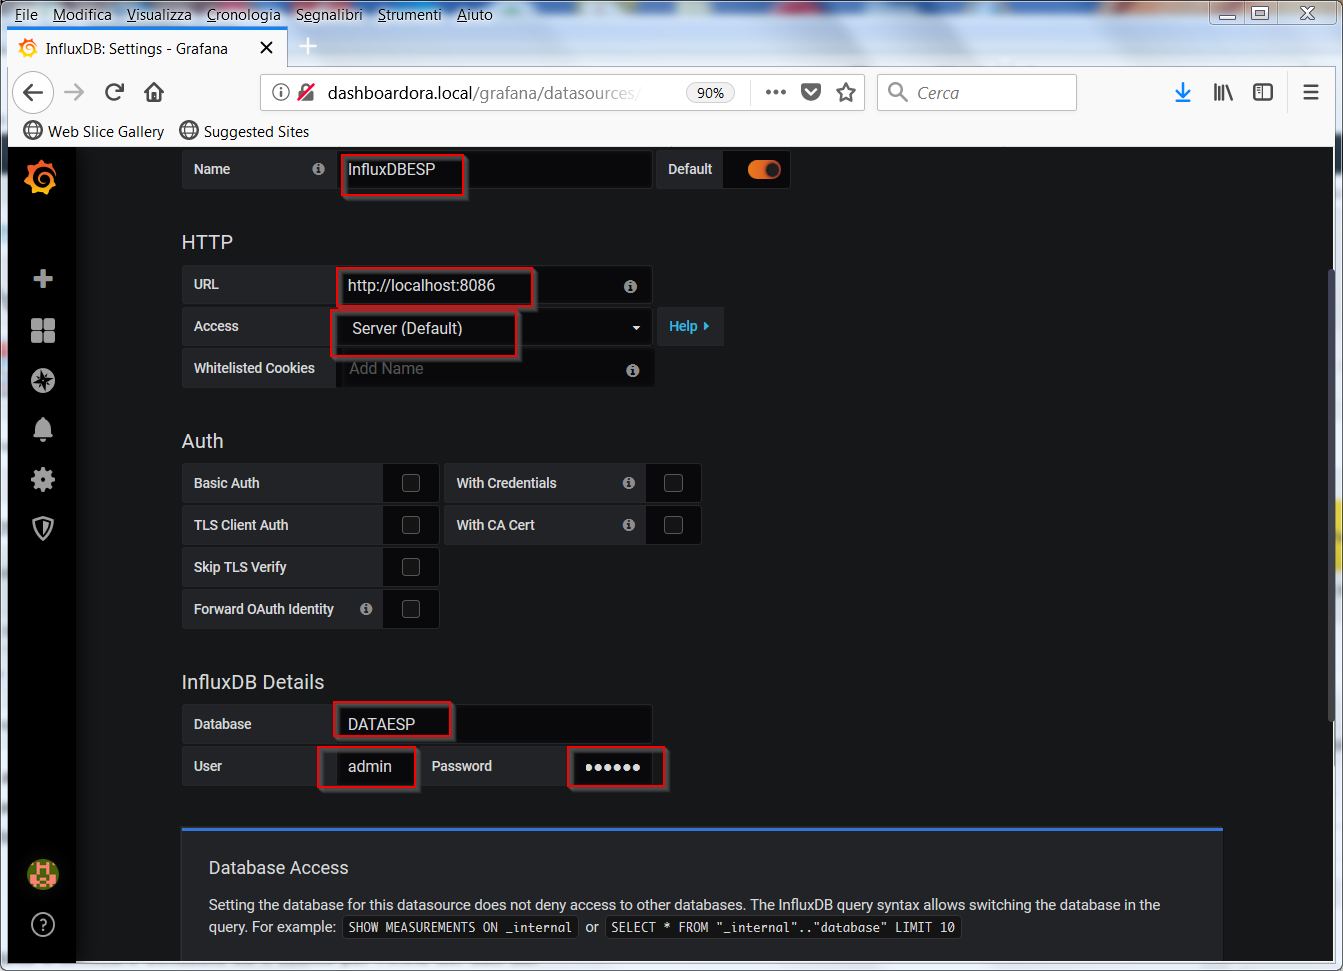 MySql
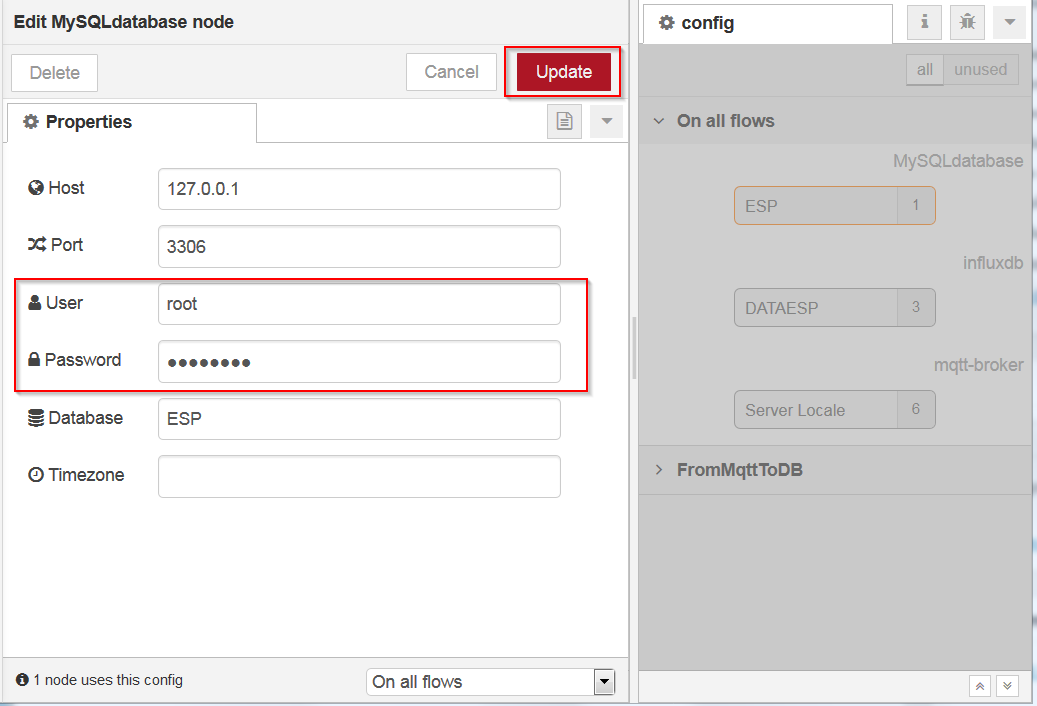
MySql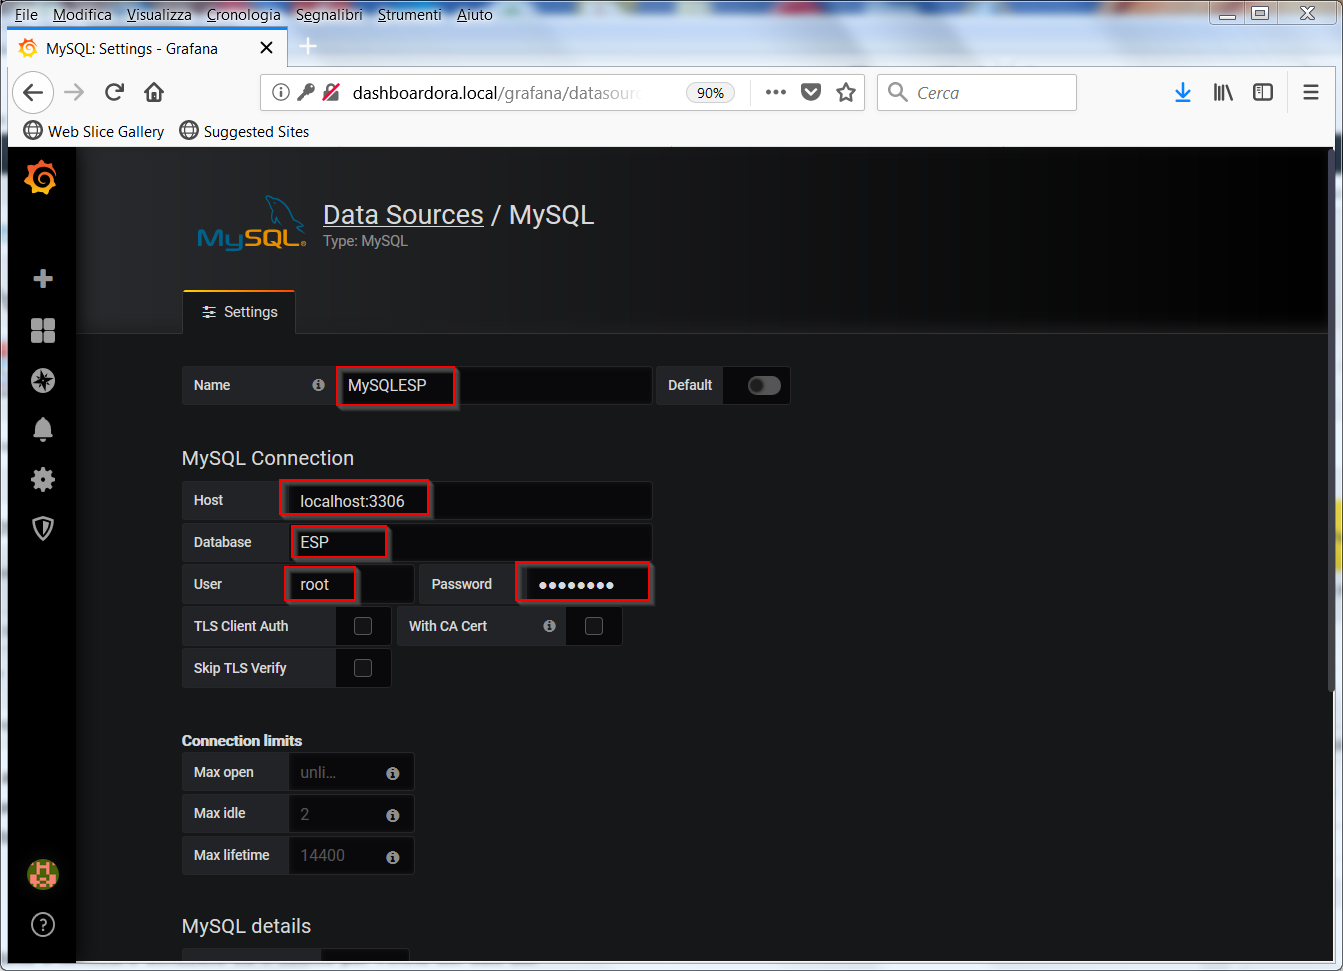 The two connections are listed in the datasource configuration
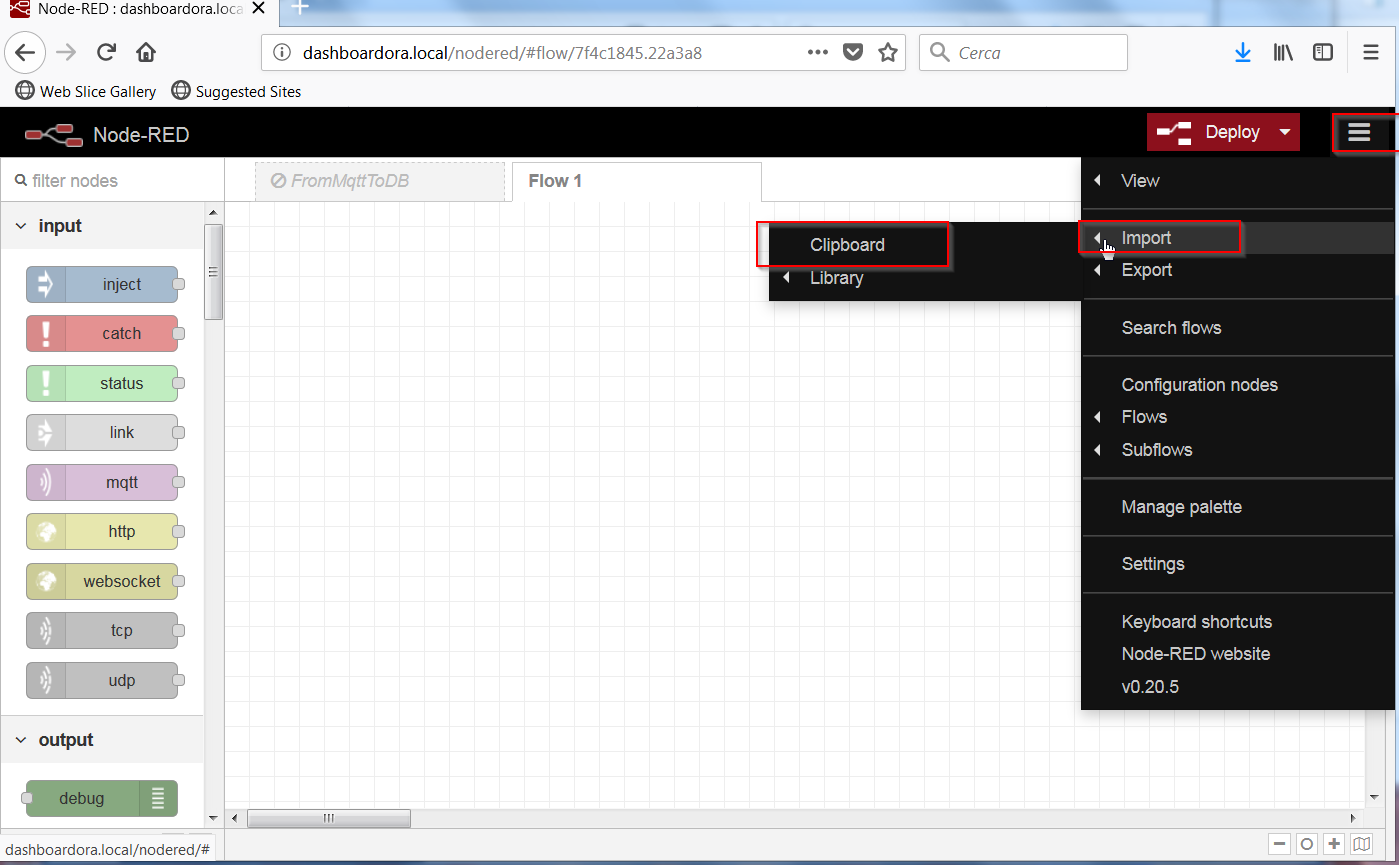
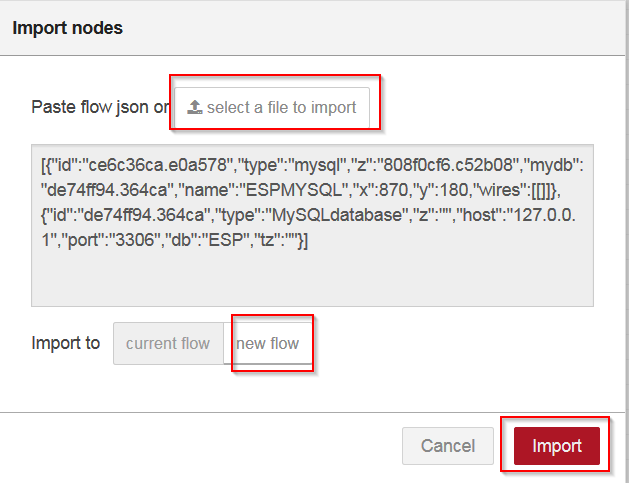
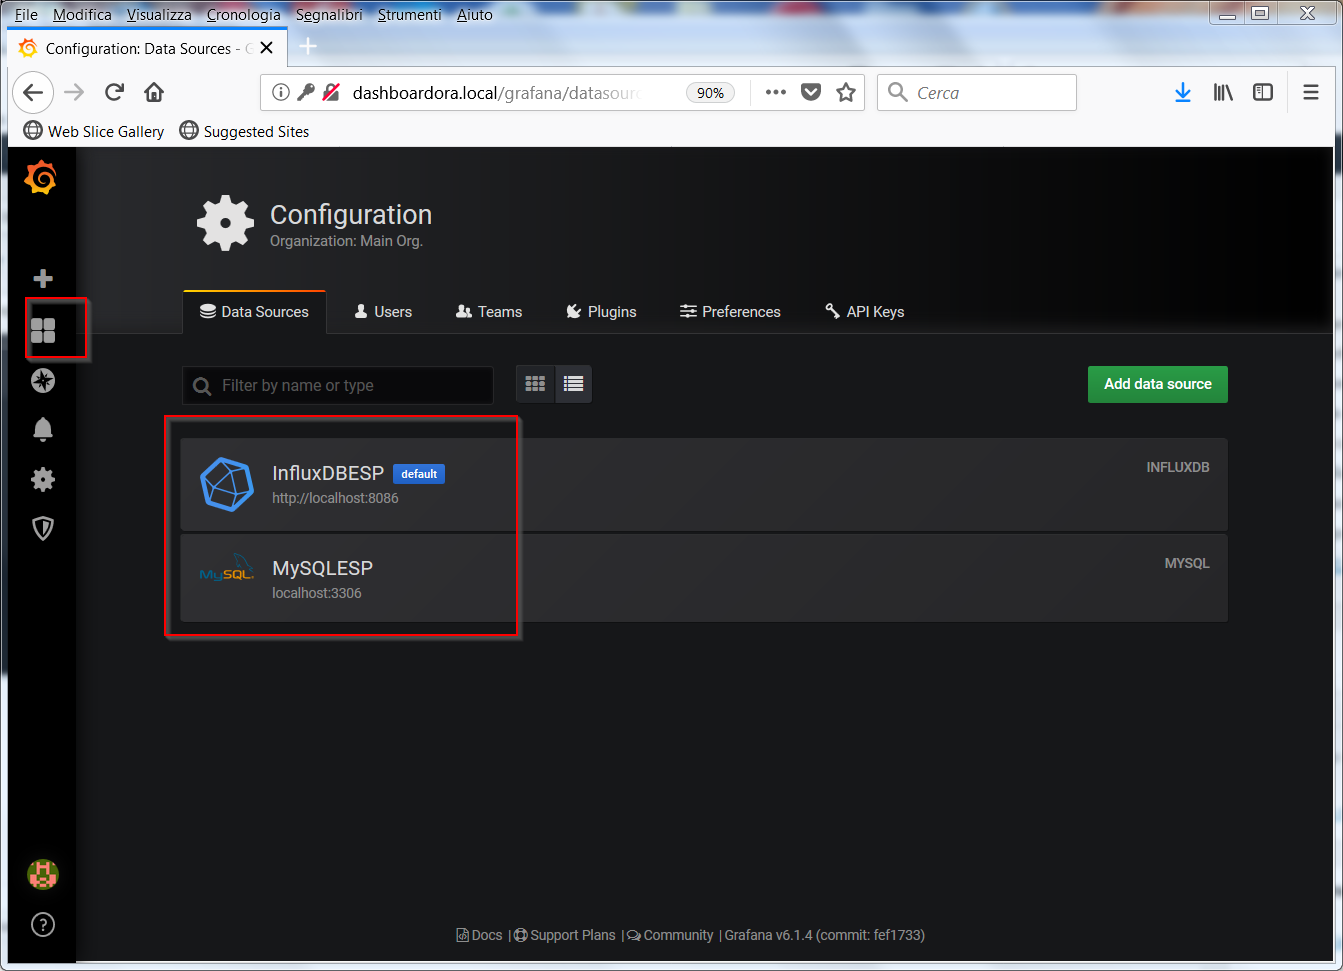 Below there is the export of the two Dashboards used in the article to be imported on your system with the Import button
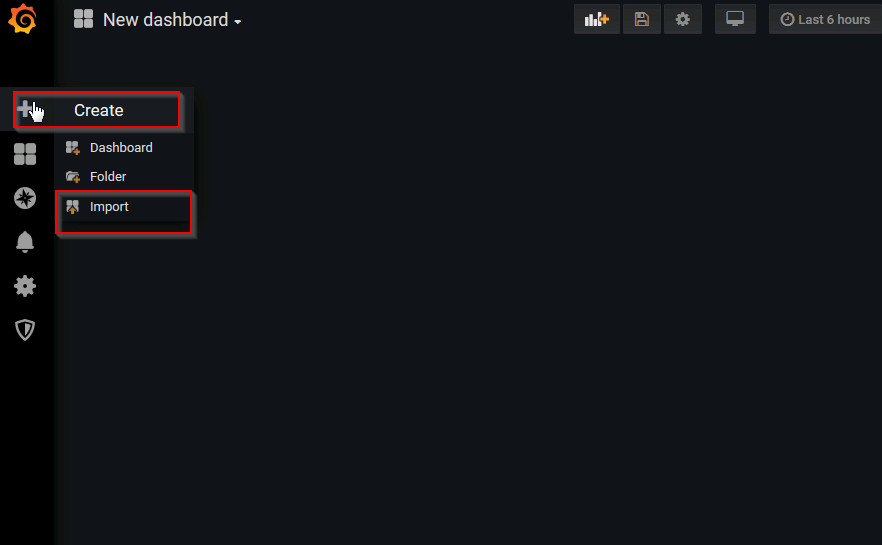
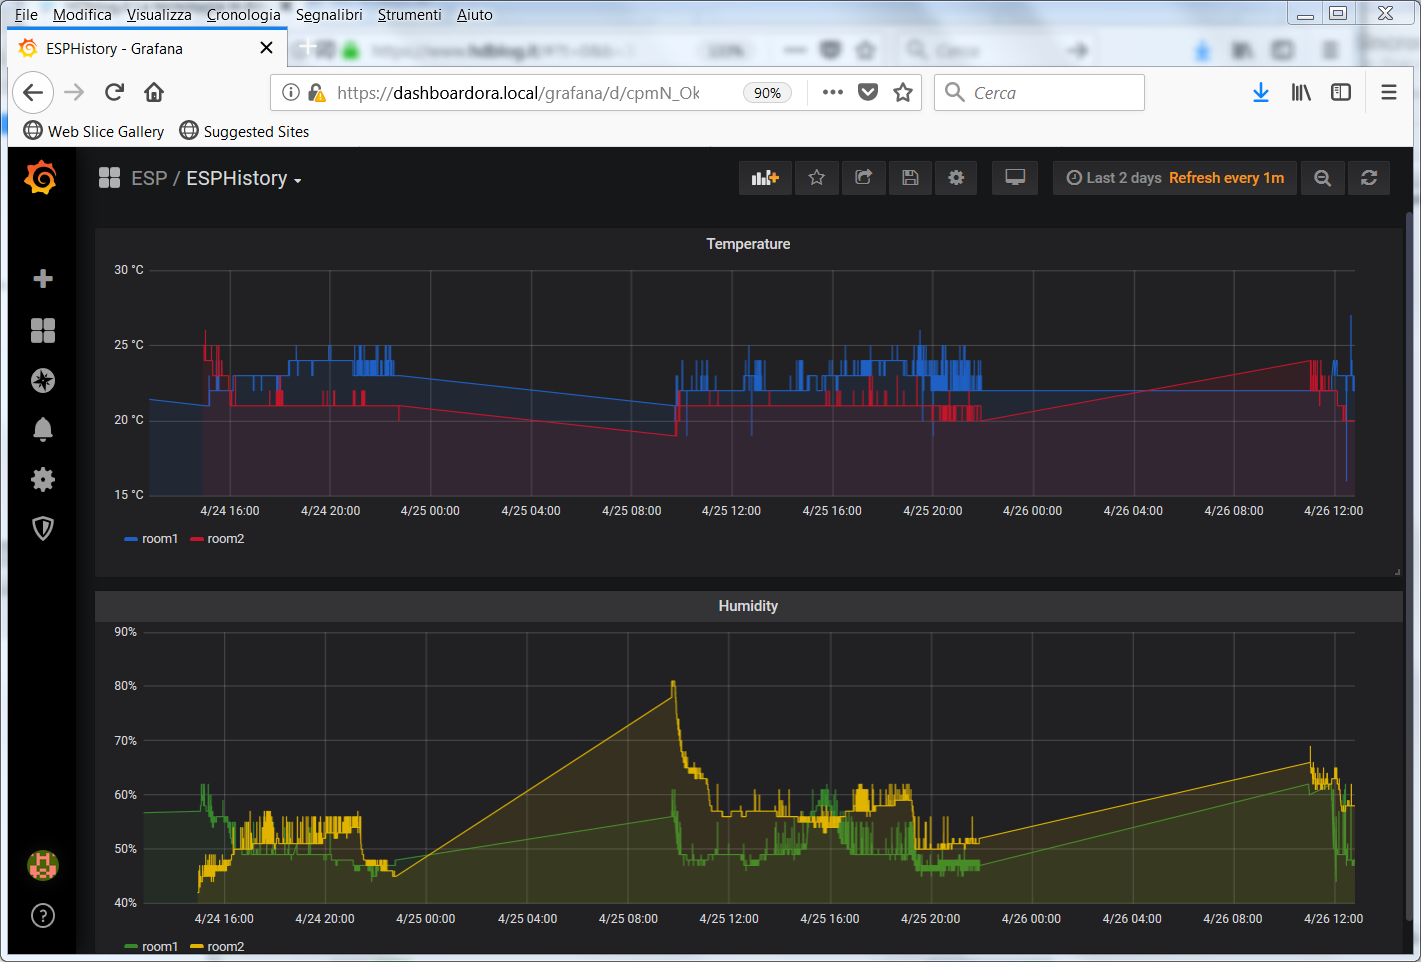
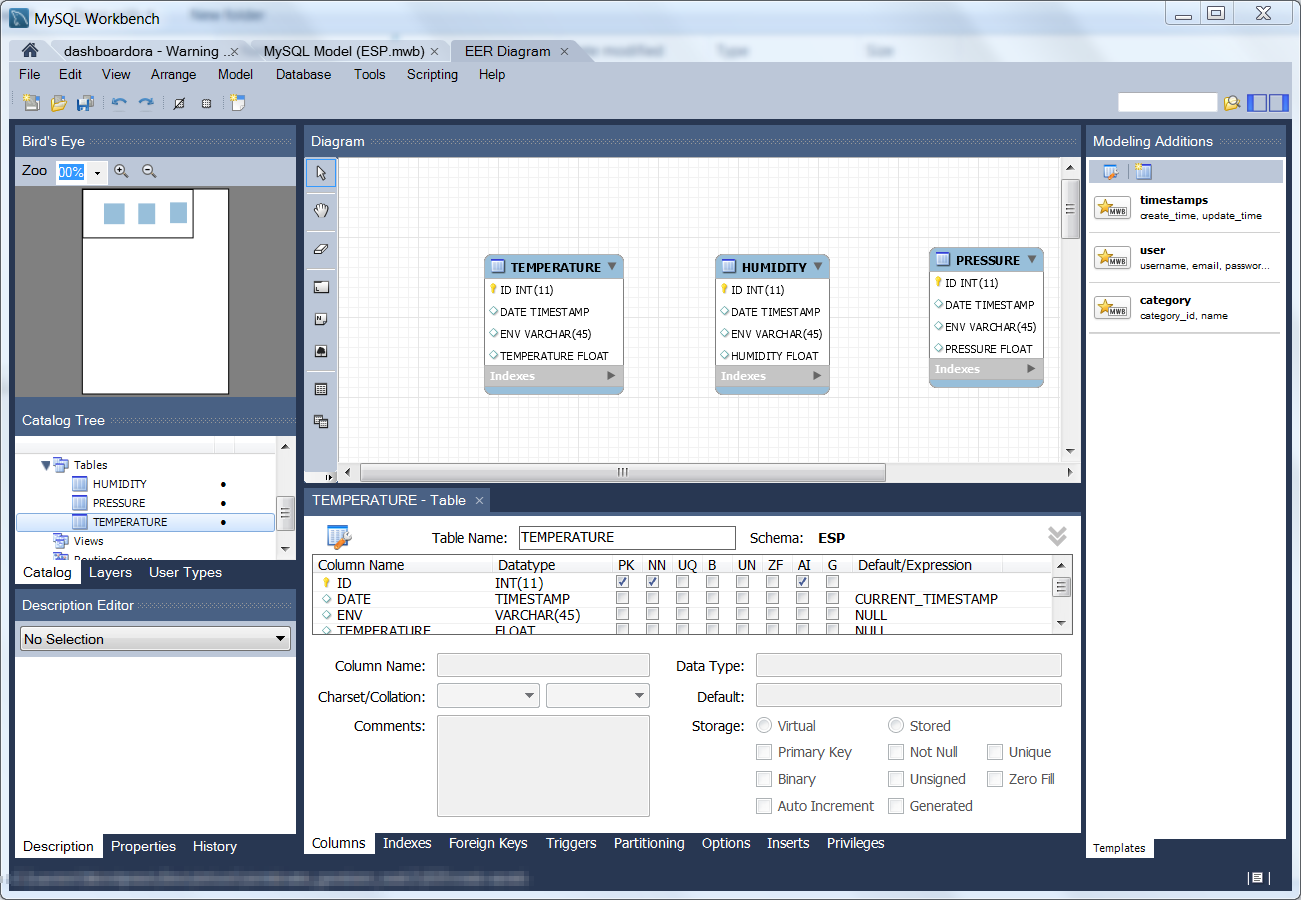
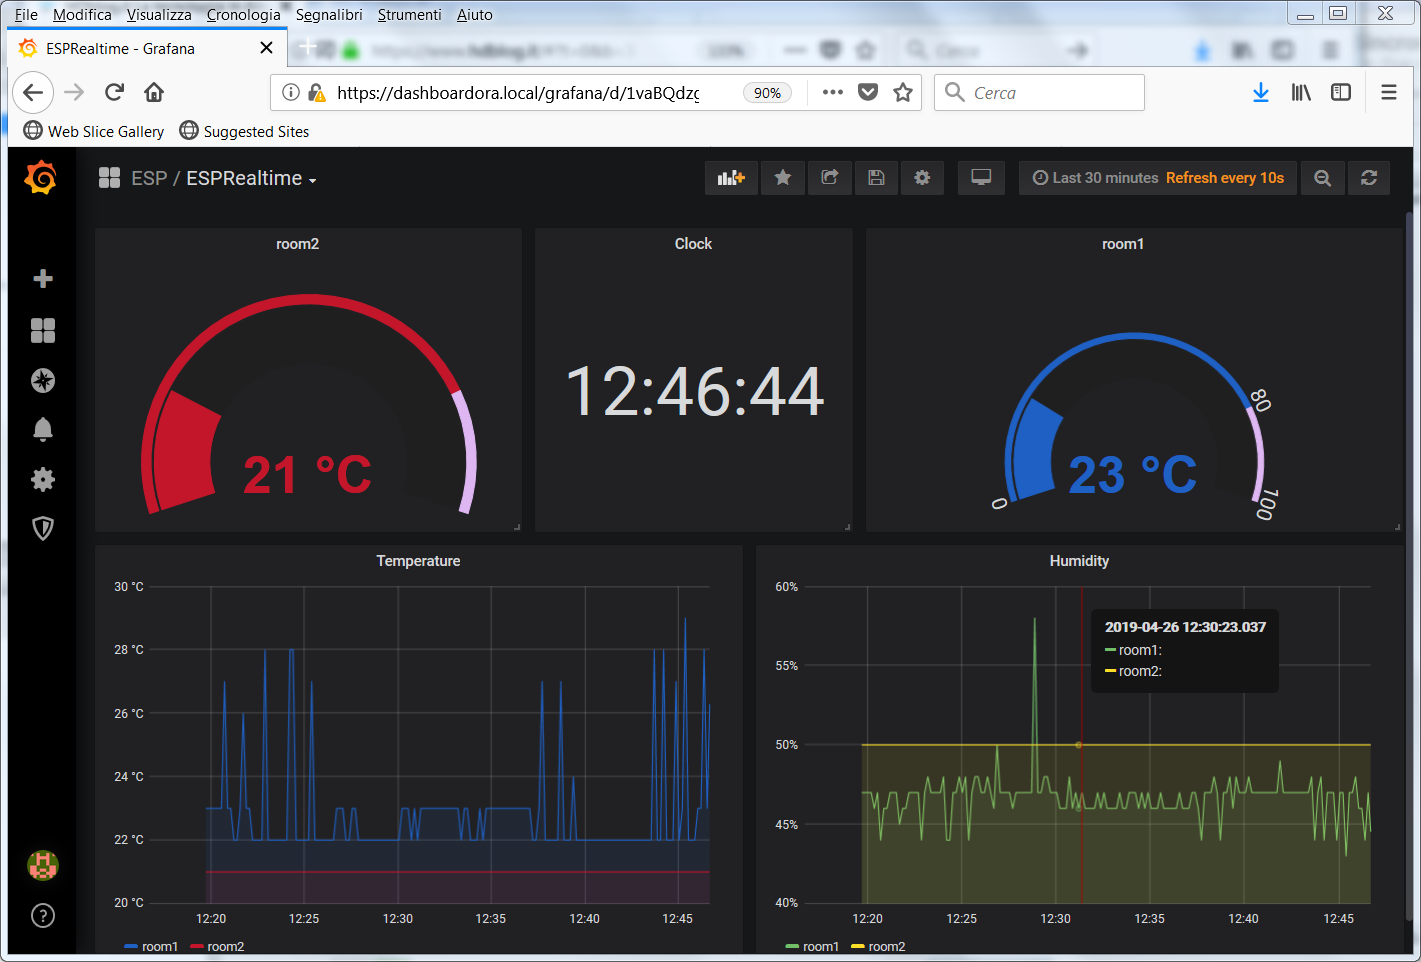 To view the data history, we use MySql data in the ESPHistory Dashboard