Tag Archives: iot

Seeeduino XIAO – Objects Detection

After the Arduino IDE environment  configuration for the Seeeduino XIAO board in the previous article

Seeeduino XIAO – Arduino Envinronment

in this we will make a small example with this card.

In the project we’ll use the following components

  1. Ultrasonic sensor HC-SR04
  2. I2C  Oled  Display 0,96 pollici SSD1306

The first step is to install the libraries of the two components listed above on Arduino.

In the Arduino IDE, go to the menu  Sketch->Include Library->Manage Libraries
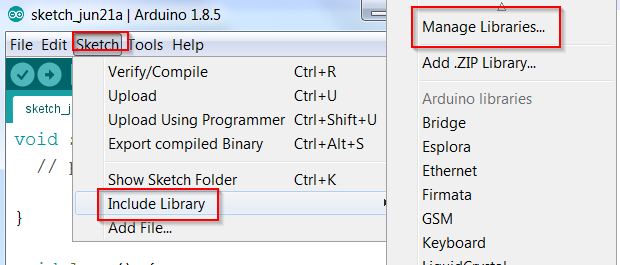
addlib-enFor HCSR04 we choose HCSR04 by Martin Sosic
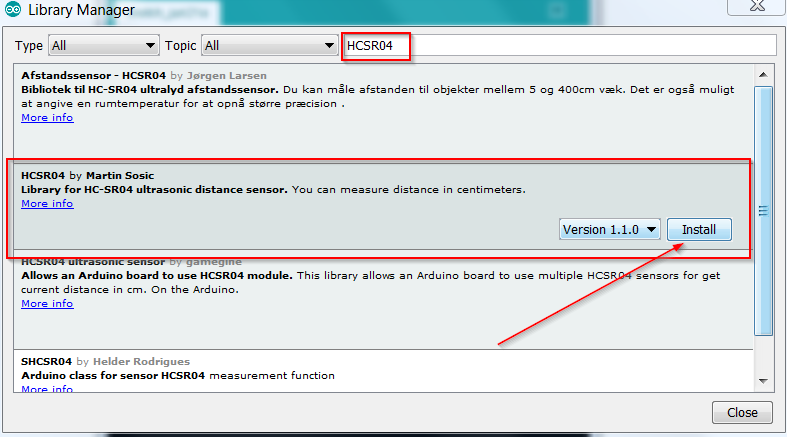
hcsr04-enFor SSD1306 we choose ACROBOTIC SSD1306

SSD1306-en

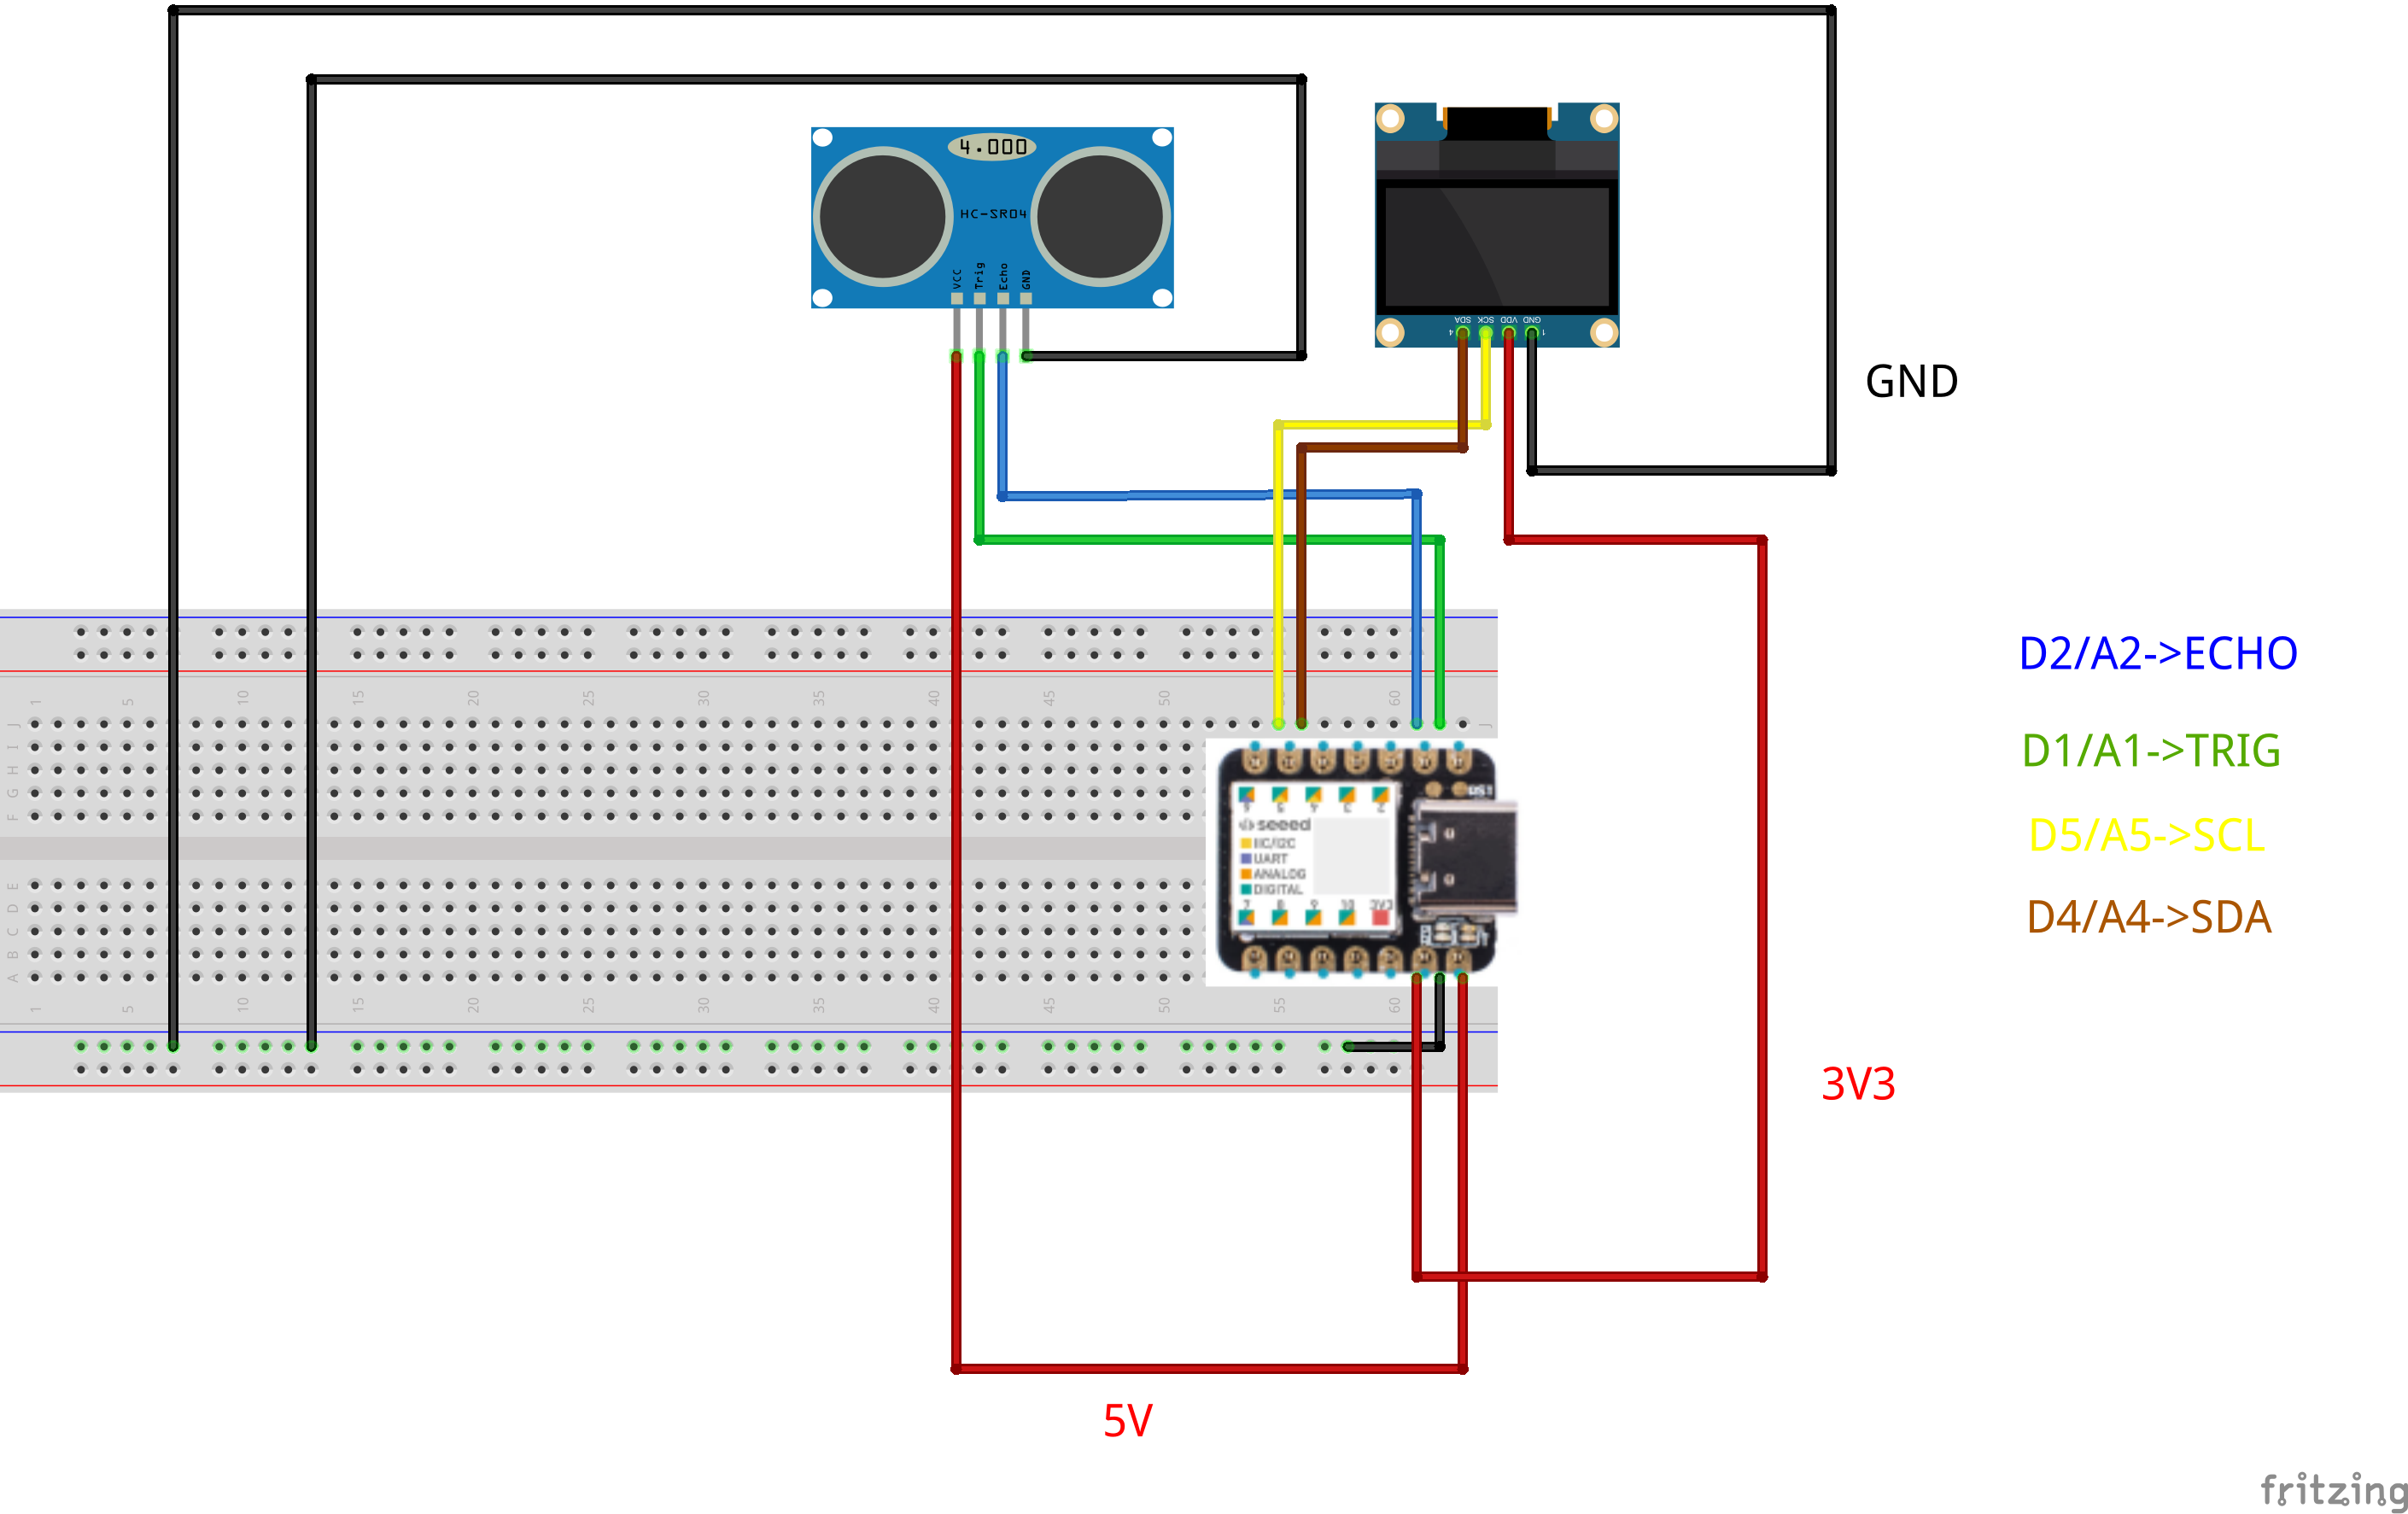
Now we have all the components for the project. We connect the components to the Seeeduino XIAO as listed in the following table

XIAO PINSSD1306 PINHCSR04 PIN
3V3VDD
GNDGNDGND
5VVCC
D2ECHO
D1TRIG
D5SCK
D4SDA

As can be seen from the table, we use the I2C and digital pins 1,2  of the XIAO
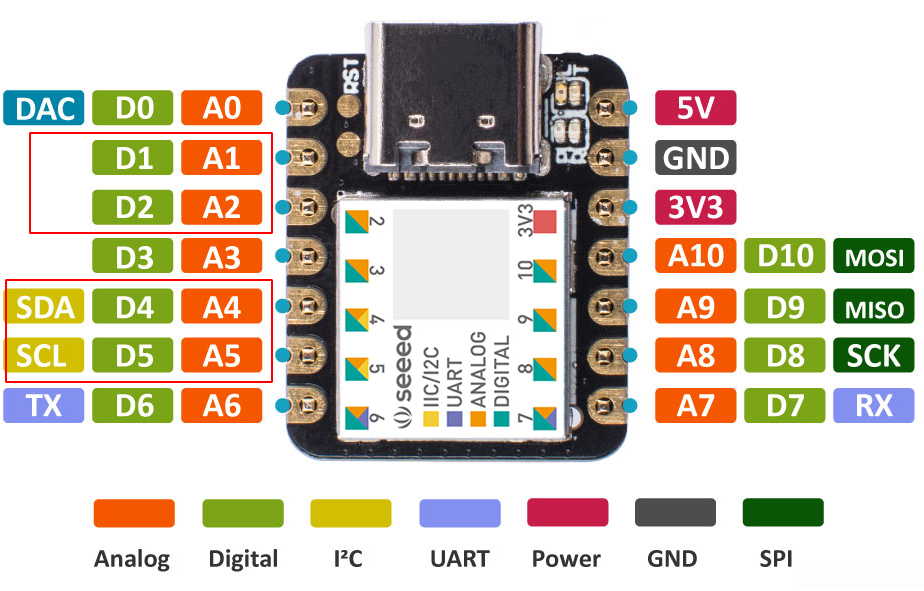
pinsexampleBelow is the connections diagram

xiaoconnectionsThe example code is the following

If an object passes through the sensor’s field of view, the event is signaled on the OLED screen with the recorded measurement. Inside the code there are the descriptions of all the operations performed.

Here is the link to the source code file

exampleXiao.ino

Seeeduino XIAO – Arduino envinroment

After listing the main features of the Seeeduino XIAO board

Seeeduino XIAO Board

in this article we prepare the Arduino development environment.

The first step is to download the Arduino Ide

Arduino IDE

Our Arduino IDE version is 1.8.5.

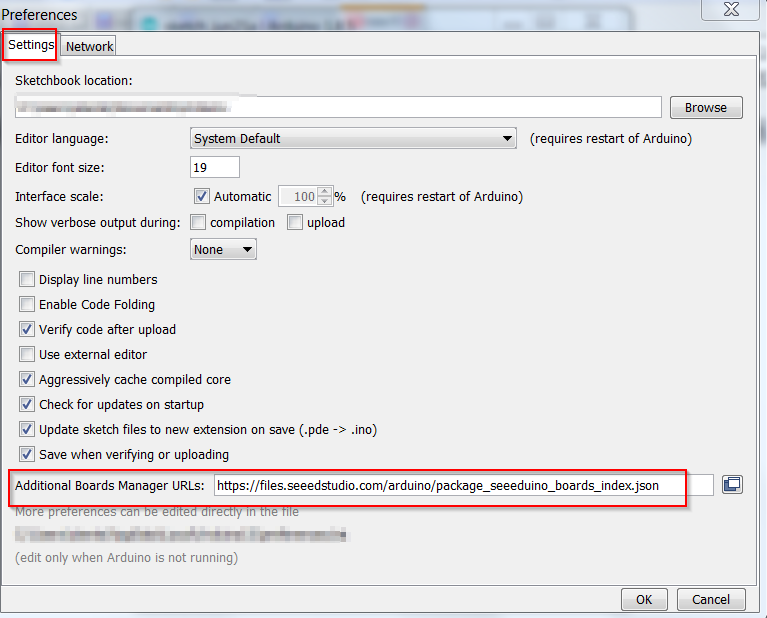
After downloading the IDE, start it and add the Seeeduino XIAO board repository by accessing File-> Preferences. In the tab “Settings” locate the “Additional  Board Manager URLs ” field and  add the link

https://files.seeedstudio.com/arduino/package_seeeduino_boards_index.json

board-enPress OK to update the settings.

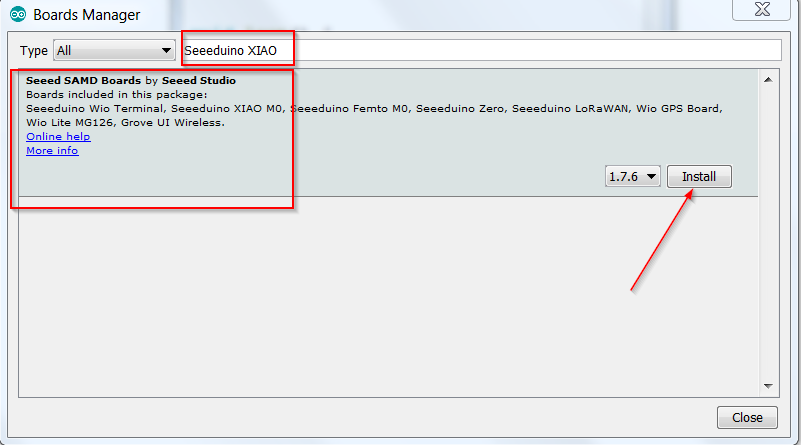
Open now  Tools->Boards->Board Manager and enter in the search box “Seeeduino XIAO”.

xiao-en

The “Seeed SAMD Boards” card is identified. It is installed with the “Install” button.

At this point on Linux the card is already visible on the USB port, while in Windows 7 we installed also the drivers available at the link

Windows Drivers

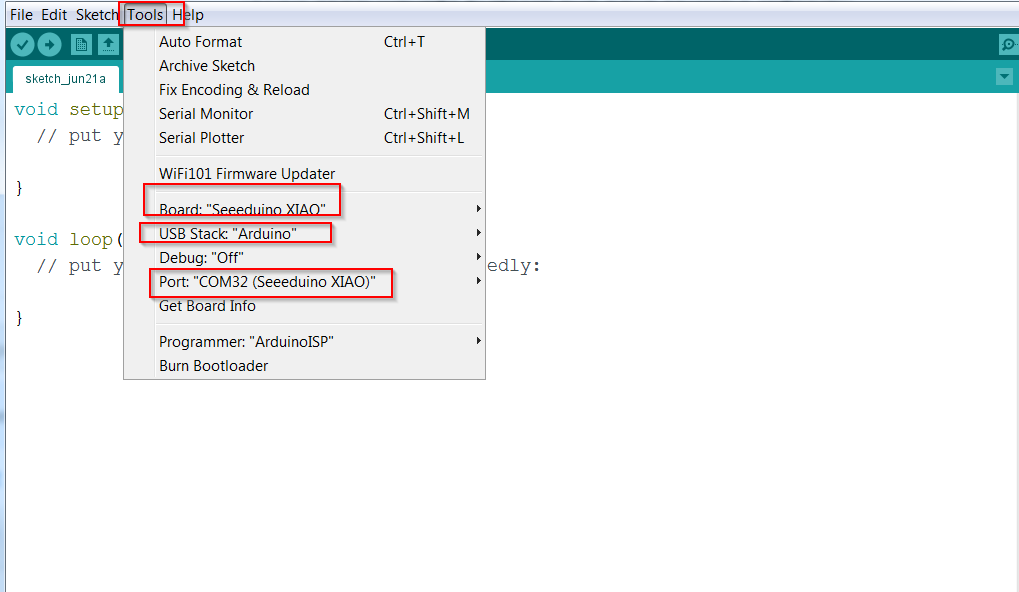
The following parameters are set for the Seeeduino XIAO board from the Tools menu

  • Board:Seeeduino XIAO
  • USB Stack: Arduino
  • Port: USB port connected to the XIAO. In the port description is visible the reference (Seeeduino XIAO)

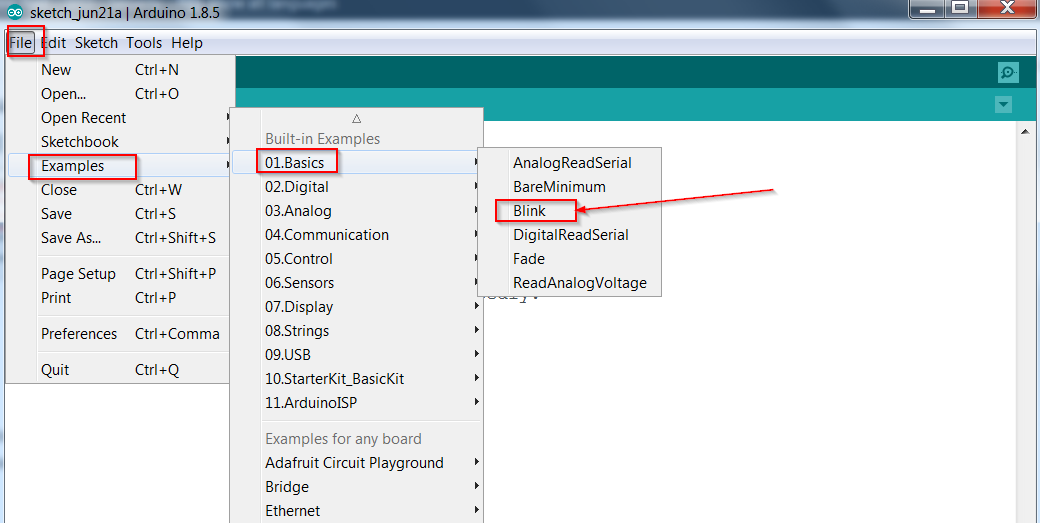
xiasetttings-enTo check that the whole environment is installed correctly, try the Arduino Blink test example, available in the menu File->Examples->01.Basics->Blink

blink-en

The example does nothing but turn off and on the yellow LED on the device.

In the next article we will make a small example with devices connected to the pins of the Seeeduino XIAO

Seeeduino XIAO – Objects Detection

Seeeduino XIAO Board

This article describes the Seeeduino XIAO development board

Seeeduino XIAO

Seeeduino-XIAO-pinout

The general specifications of the card are

CharacteristicValue
CPUARM Cortex-M0+ CPU(SAMD21G18) running at up to 48MHz
Flash Memory256KB
SRAM32KB
Digital I/O Pins11
Analog I/O Pins11
I2C interface1
SPI interface1
UART interface1
Power Led Green
Test LedYellow
TX Serial LedBlue
RX Serial LedBlue
Power supply and downloading interfaceUSB Type C
Supply Voltage3.3V/5V DC
Dimensions20×17.5×3.5mm

As shown in the  table,  peculiar aspects of the board are the following

  • Powerful CPU: ARM® Cortex®-M0+ 32bit 48MHz microcontroller(SAMD21G18) with 256KB Flash,32KB SRAM.
  • Compatible with Arduino IDE and CircuitPython.
  • Breadboard-friendly.
  • As small as a thumb(20×17.5mm) for wearable devices and small projects.
  • Multiple development interfaces: 11 digital/analog pins, 10 PWM Pins, 1 DAC output, 1 SWD Bonding pad interface, 1 I2C interface, 1 UART interface, 1 SPI interface.

Here are the links to the Seeed wikis for configuration with Arduino and CircuitPython

Seeeduino XIAO with IDE Arduino

Seeeeduino XIAO with CircuitPython

CircuitPython is a simplified Micropython derived project for microcontrollers

CircuitPython 

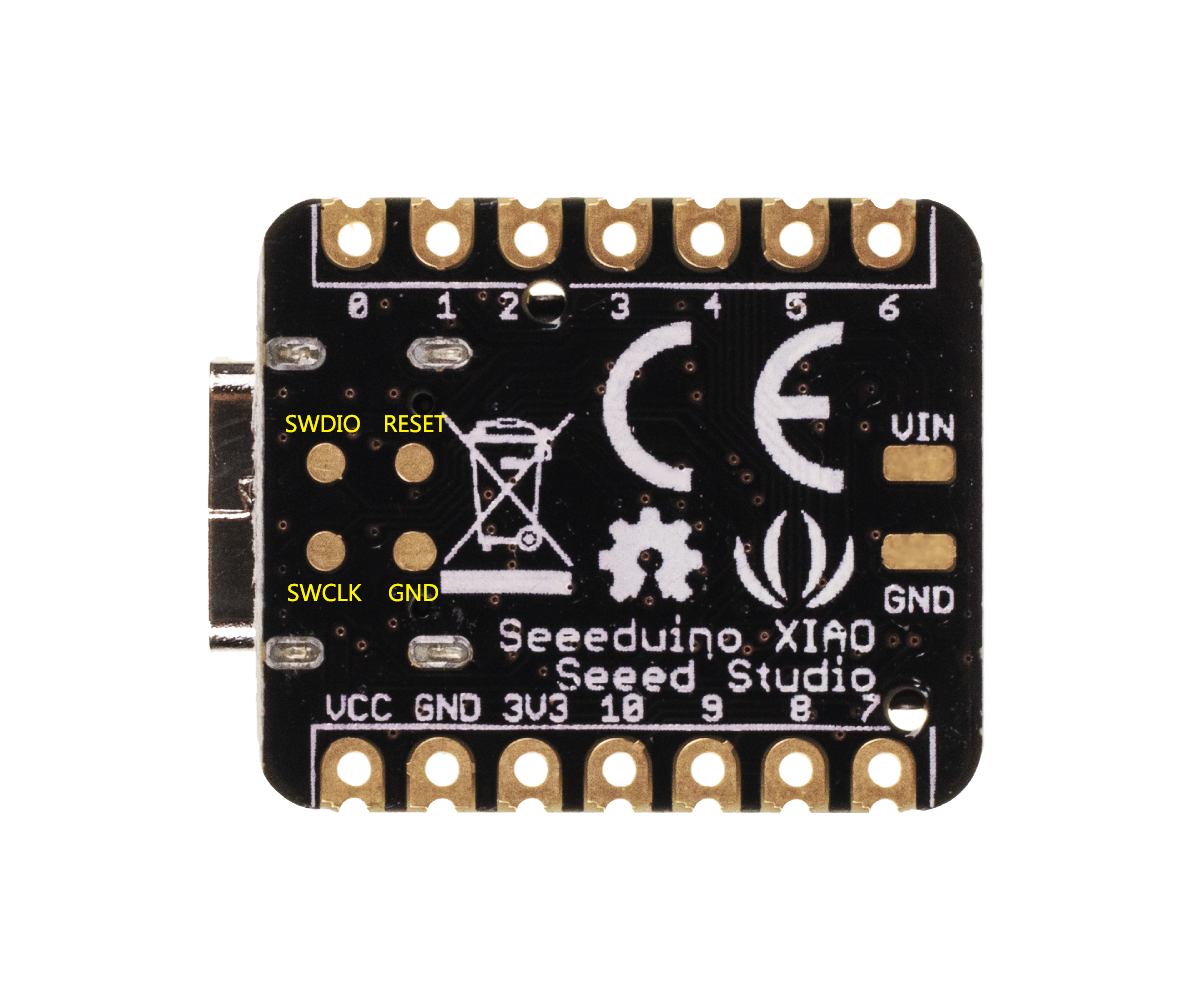
The board is programmed via USB Type C connection. It also offers a pad for power supply as well as the SWD (Serial Wire Debug) interface in the back part.

seeeduino-xiao-pinout-back

The board supports multiplexing pin and the same pin can be used,depending on the function that uses it,  as analog, digital pin, etc.

On the upper part of the board there are two pins for resetting the board itself and for setting it in dfu mode for loading another bootloader (for example CircuitPython).

Seeeduino-XIAO-reset

To reset or load another bootloader, connect the board via USB Type C and reset it by short-circuiting quickly the reset pins. When the orange LED starts to light up and  flicker, the board is ready to load the firmware. Use this method even if the board is no longer visible on the USB port of the PC.

The board is available directly from the Seeed website

Seeeduino XIAO

In the next articles we set up the Arduino IDE for a small project with Seeeduino XIAO

Seeeduino XIAO – Arduino envinronment


About Seeed

Seeed is the IoT hardware enabler providing services over 10 years that empower makers to realize their projects and products. Seeed offers a wide array of hardware platforms and sensor modules ready to be integrated with existing IoT platforms and one-stop PCB fabrication and PCB assembly service. Seeed Studio provides a wide selection of electronic parts including Arduino Raspberry Pi and many different development board platforms Especially the Grove System help engineers and makers to avoid jumper wires problems. Seeed Studio has developed more than 280 Grove modules covering a wide range of applications that can fulfill a variety of needs.

Sensors Monitoring – Grafana Configuration

After configuring nodered to forward the data to the databases, temperature and humidity sensors are used with ESP8266, as already seen in the previous articles

Mqtt with Beaglebone and ESP8266 – Articles List

Below is the firmware used and the code for sending data from the ESP8266 nodes

ESP8266 Firmware

ESP8266 Temp-Hum

Inside the zip file there is a script to upload the firmware to the COMX port (to be modified with your COM port) on windows.

In the LUA code instead it is necessary to enter the settings of your wireless router, the mqtt ip address, the room settings, replacing roomx, with room1, room2,etc.

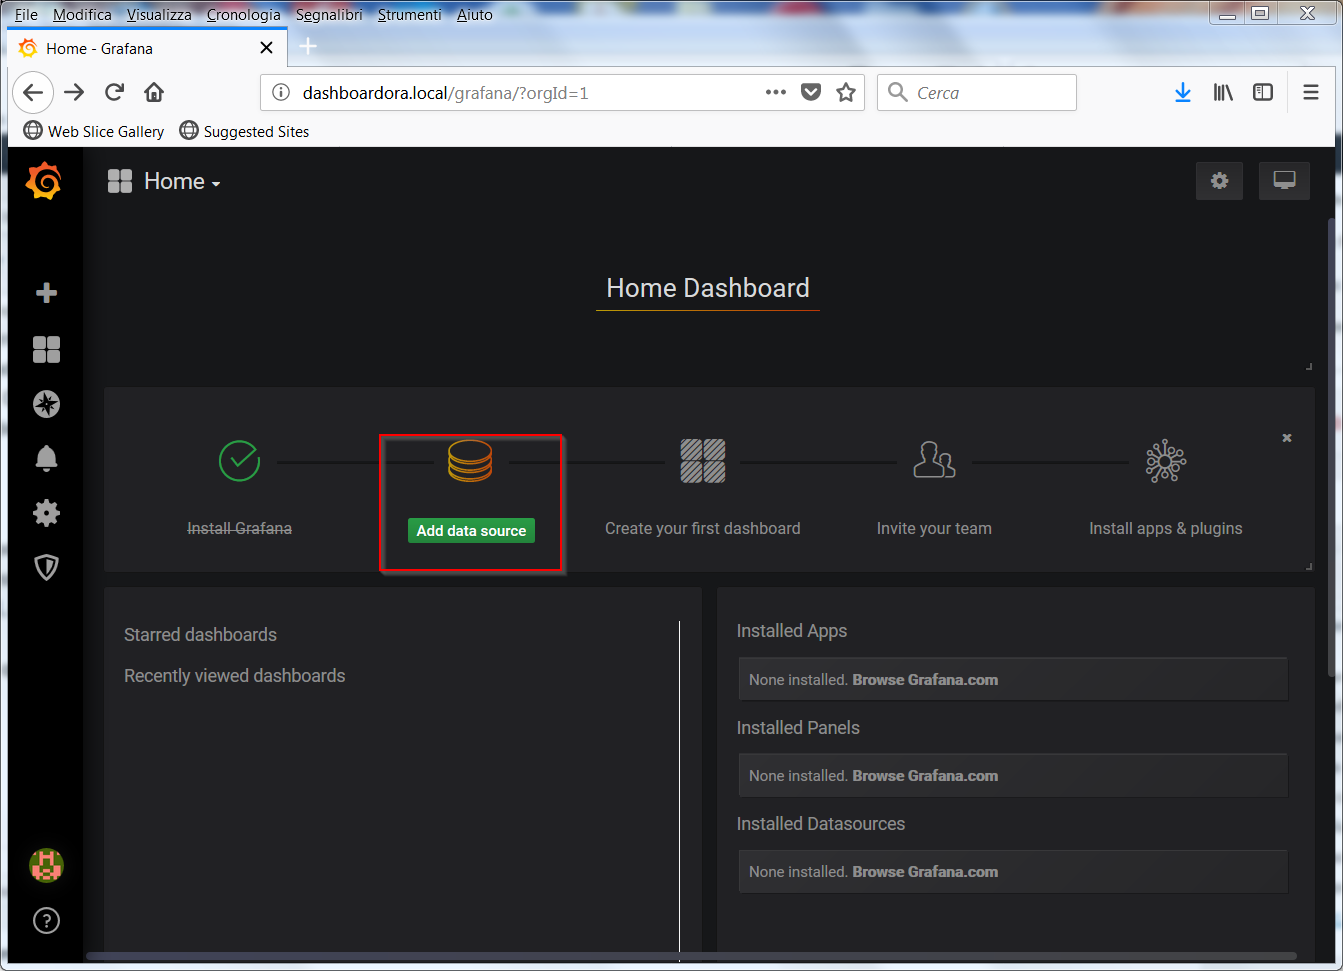
You can then set Grafana, accessing the Dashboard, adding Mysql and InfluxDB as data sources

grafanaSourceWith Add data source you access the Data Source screen, from which you can choose InfluxDB and MySql

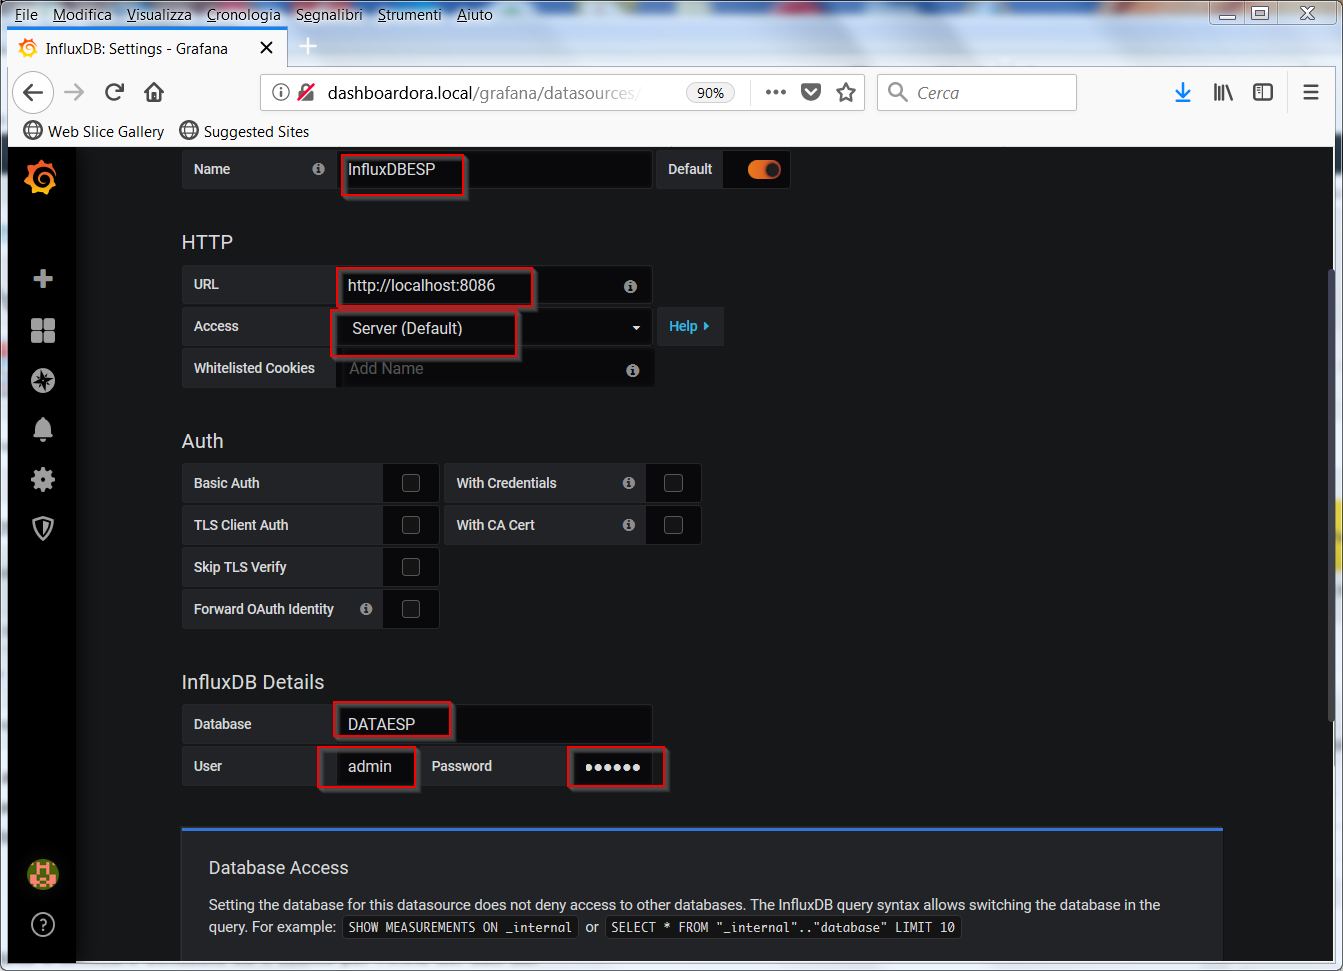
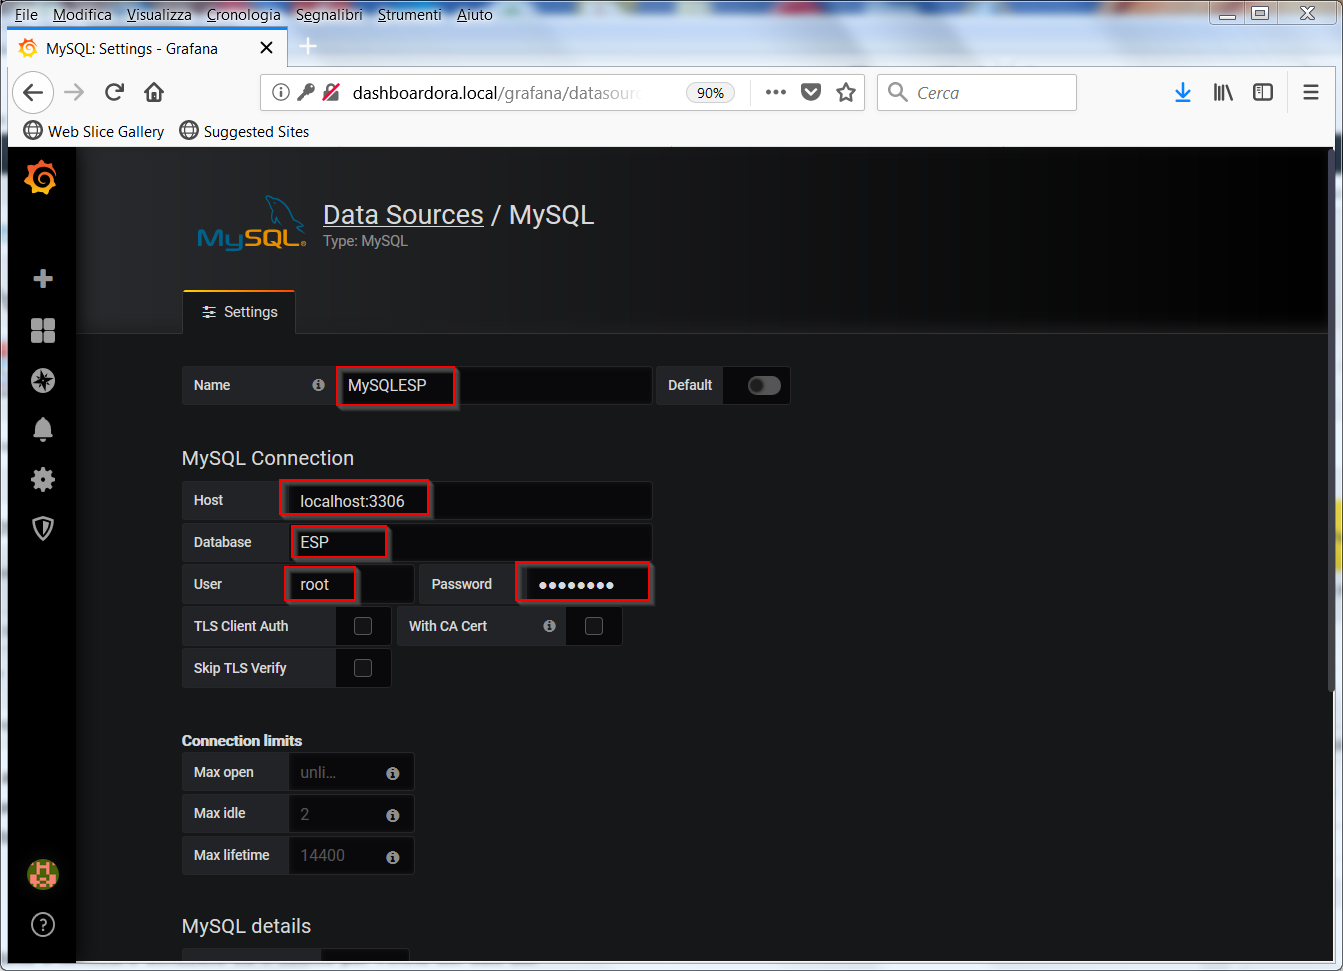
grafanaAddSourceBelow  the settings for InfluxDB and MySql

InfluxDB

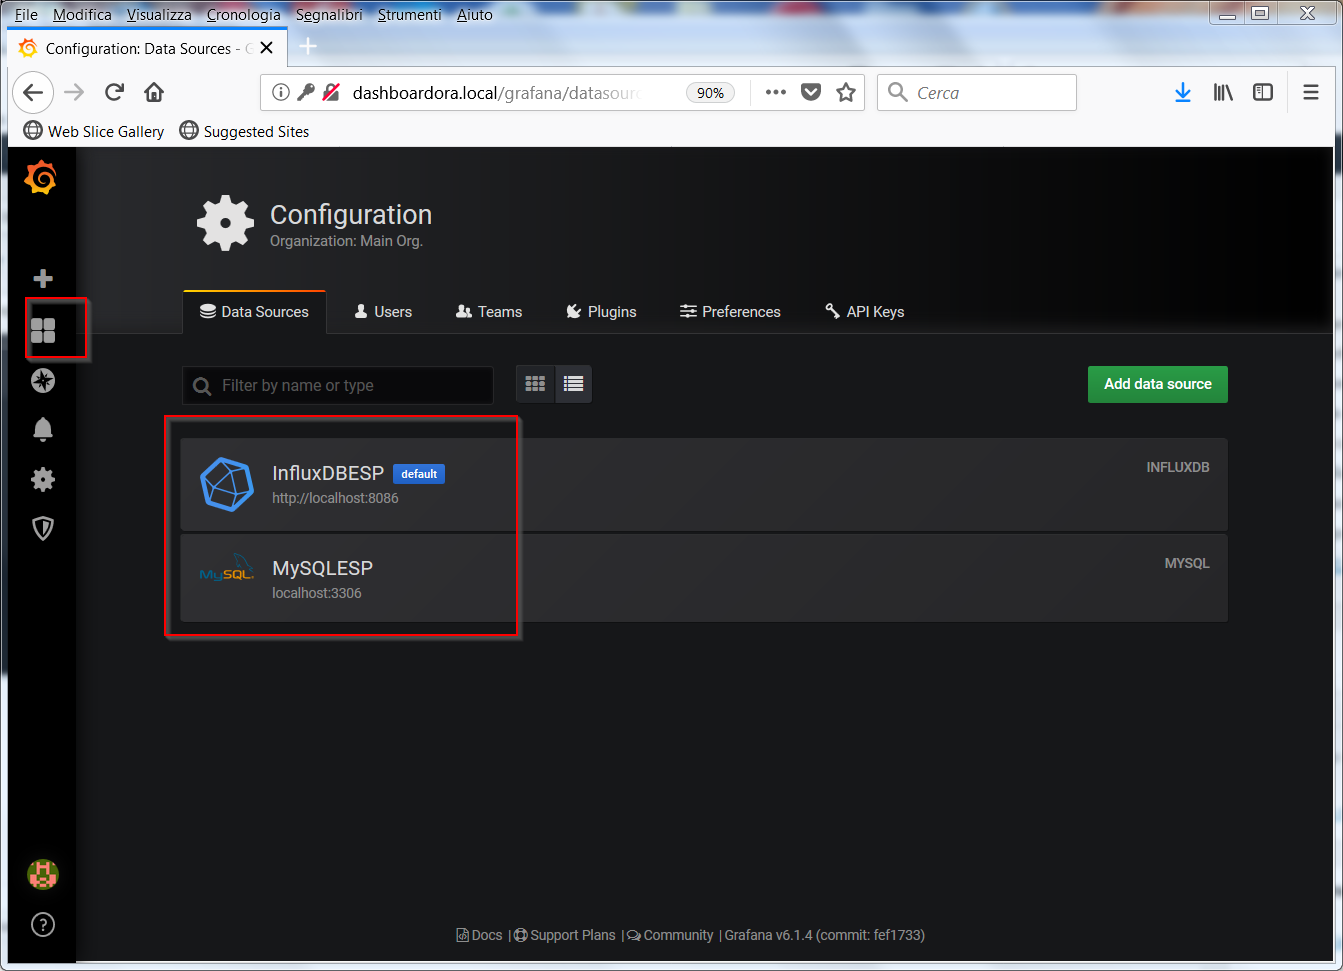
InfluxDBESPMySqlMySqlESPThe two connections are listed in the datasource configuration

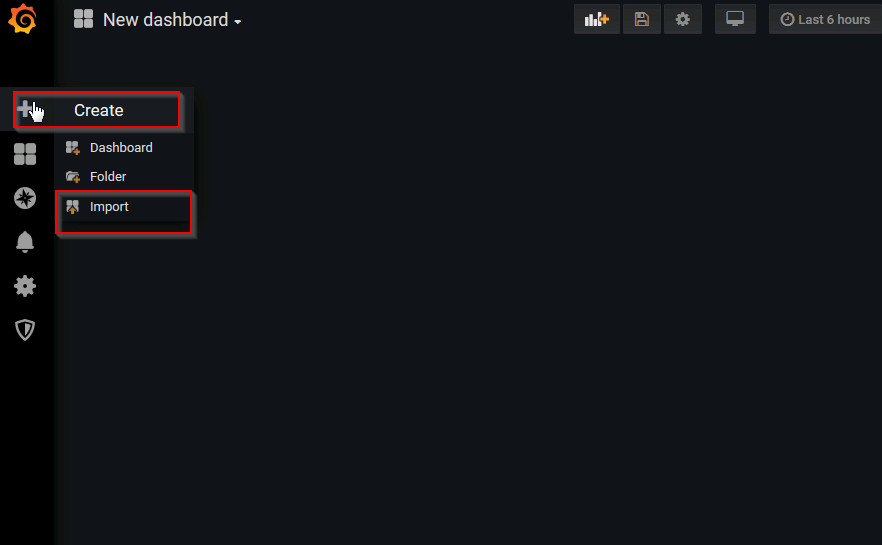
AllDataSourceBelow there is the export of the two Dashboards used in the article to be imported on your system with the Import button

importDashboards

Dashboards

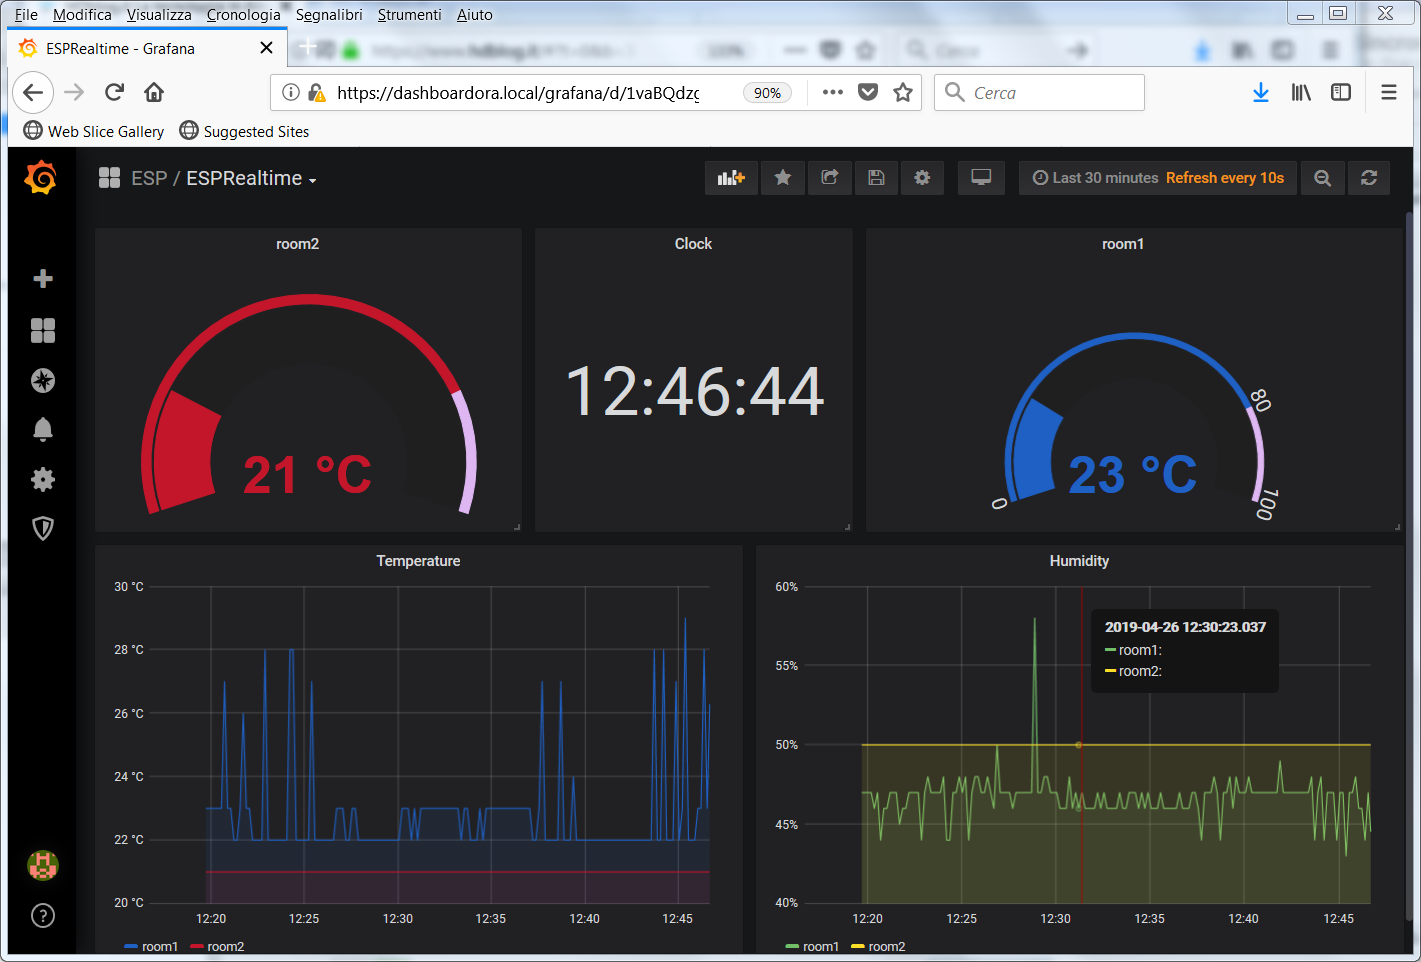
Here is the ESPRealtime Dashboard screen with the data available  on the InfluxDB

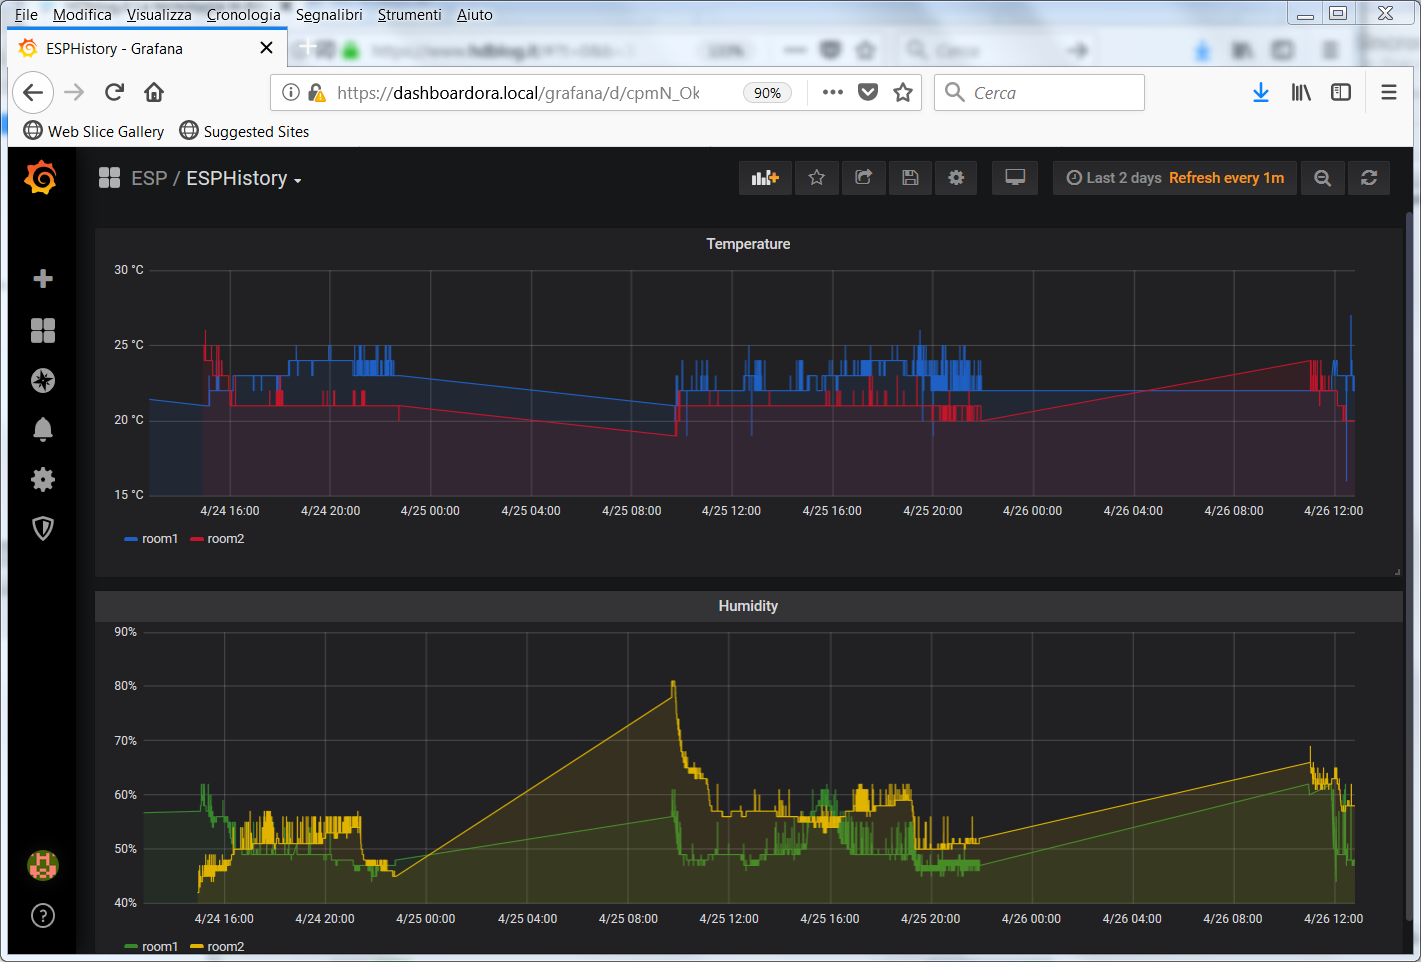
RealTimeGrafanaTo view the data history, we use MySql data in the ESPHistory Dashboard

HistoryGrafana


Sensors Monitoring – Nodered Configuration

At this point we set nodered to read the messages on Mosquitto and insert the data into InfluxDB and MySql.

Below the json file to be imported into nodered

Nodered Json

This flow is functional to the explanation of the functioning of the architecture as a whole; the flow must be optimized by programming nodered so as to automatically generate the information of the nodes from which the data arrives without resorting to different nodes for each sensor.

To execute the import proceed as follows, after accessing nodered

http://dashboardora.local/nodered

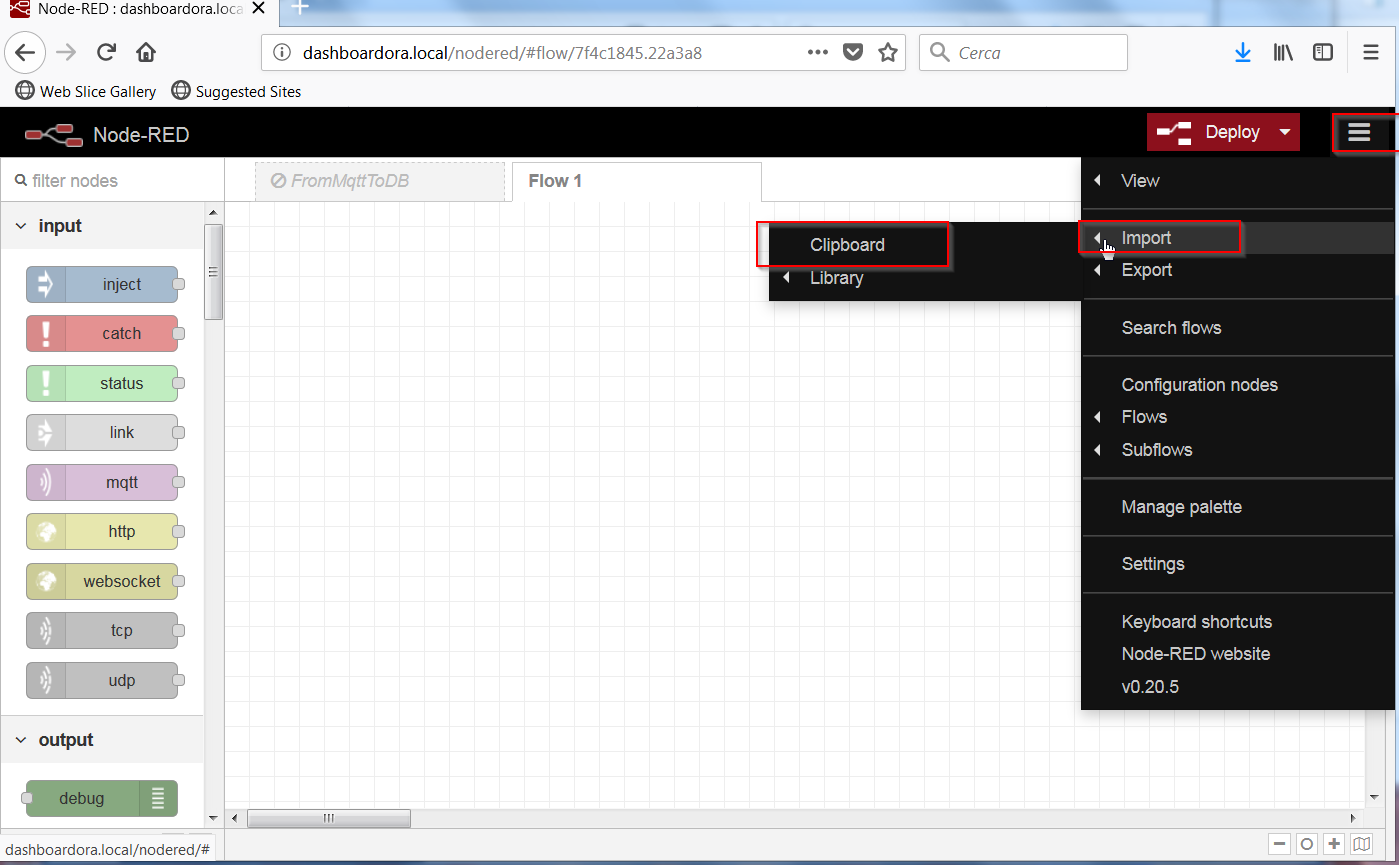
and after clicking on the menu on the right, choose to import the json from the clipboard

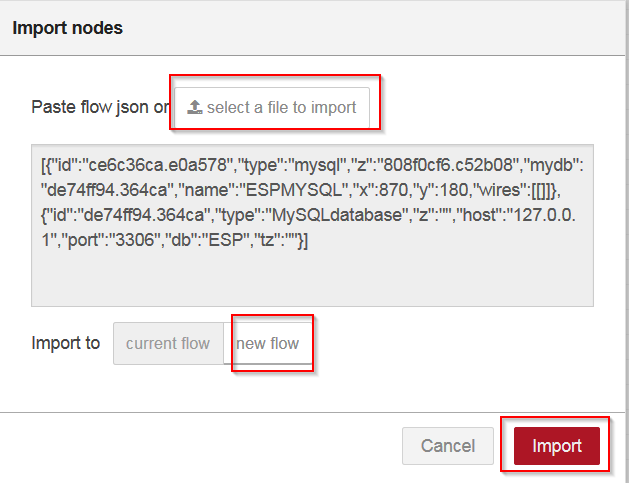
importFlowsAt the next screen, choose to import the json file into a new flow

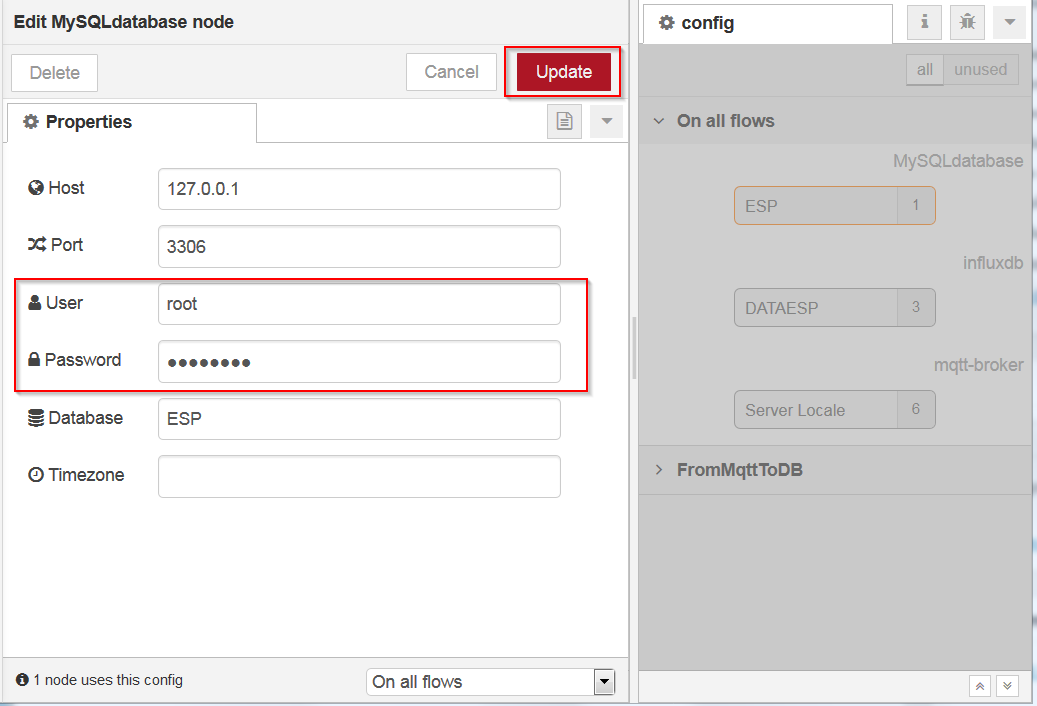
flowOnce imported, set the credentials to access MySql and InfluxDB, selecting Configuration nodes from the menu on the right and setting the user account and password

configureNodesThe connections to the dbs and mosquitto are shown

configureNodesDBBelow is the MySql setting, accessed by clicking the mouse twice on ESPMYSQL

MySqlSettingUpdate button updates the node.

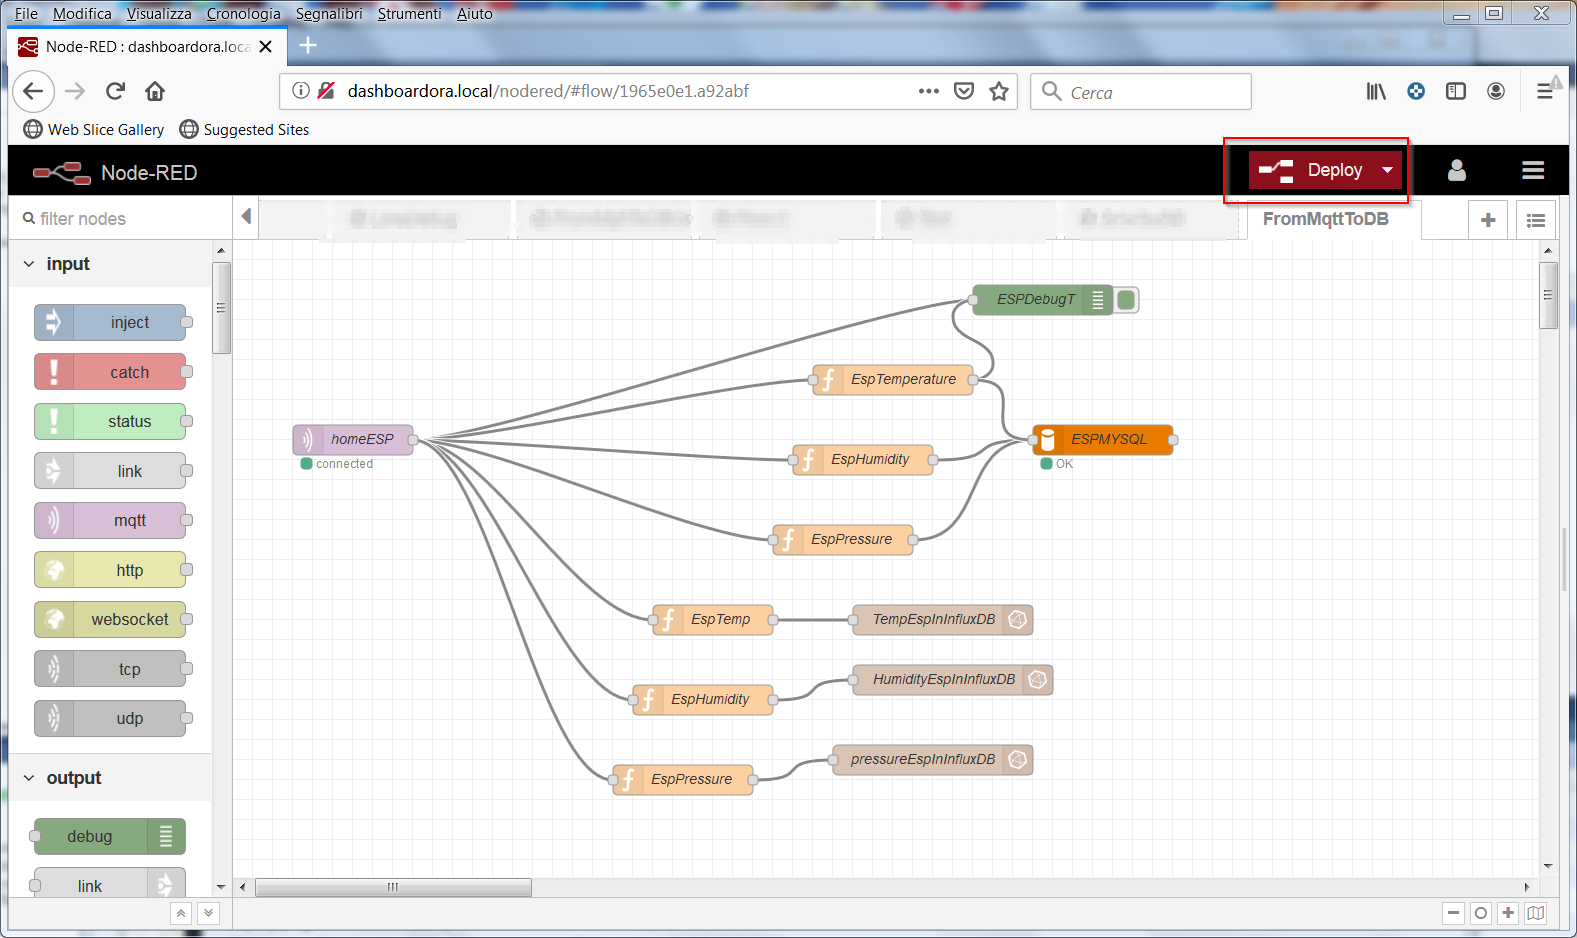
To make the flows operational click on Deploy

deploy

Now, with nodered we take the contents of the various mqtt topics and insert them into MySql and InfluxDB.

In the next article we display these data in Grafana

Sensors Monitoring – Grafana Configuration

Sensors Monitoring – InfluxDB Configuration

After MySql tables creation

Sensors Monitoring – MySql Configuration

we have to create a database  on InfluxDB.

The first step is to activate an administrative user on the system, as described in the link

Authentication and Authorization

InfluxDB  is accessed from the local client by running the influx command from a shell

Run

In the file /etc/infuxdb/influxdb.conf, using the root user or the sudo command, the auth-enabled parameter is set from false to true
Restart influxdb

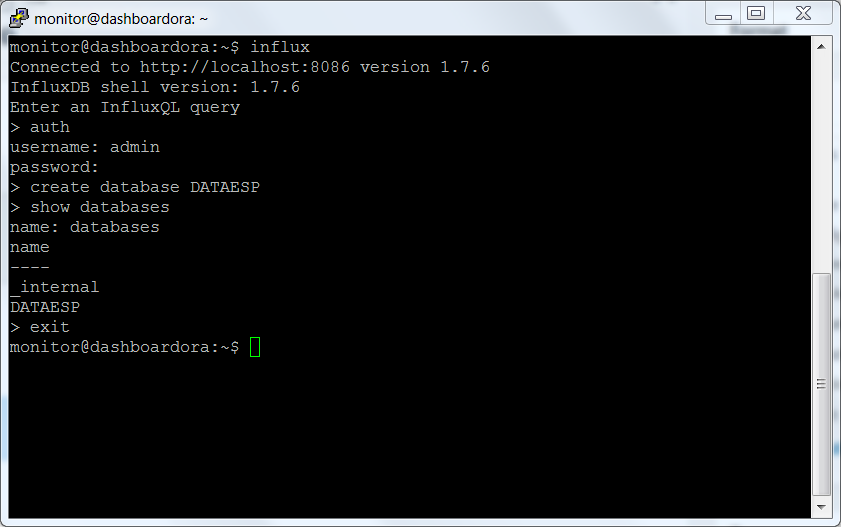
Using a command shell on Debian  create the database DATAESP with the following commands

Enter the admin credentials to the auth command and proceed to create the database

Below is the result of the commands listed above

datainfluxdb

For the management of the Influxdb database, it is possible to use Chronograph

Chronograph

The Chronograph download is available at the link

Chronograph Download

Installation can be performed in two ways.

Application start

Log in with the monitor user and in a command shell

Start the chronograf application


Start as a Service

Log in with the monitor user; use a command shell to execute

In the /opt/chronograf/usr/lib/chronograf/scripts folder there are scripts for the automatic start of chronograf.

Here are the operations performed in our system:

  • Copy /opt/chronograf/usr/lib/chronograf/scripts/init.sh into /etc/init.d/chronograf and assign execution permissions

  • Copy /opt/chronograf/usr/lib/chronograf/scripts/chronogaf.service  into /etc/systemd/system/chronograf.service

Change in both files the user and path of the various chronograf components, i.e. change the user to monitor and the paths that point to /opt/chronograf

Below is the link to the modified files

Automatic Startup Chronograf

After the modifications run

To enable it at startup and start it run

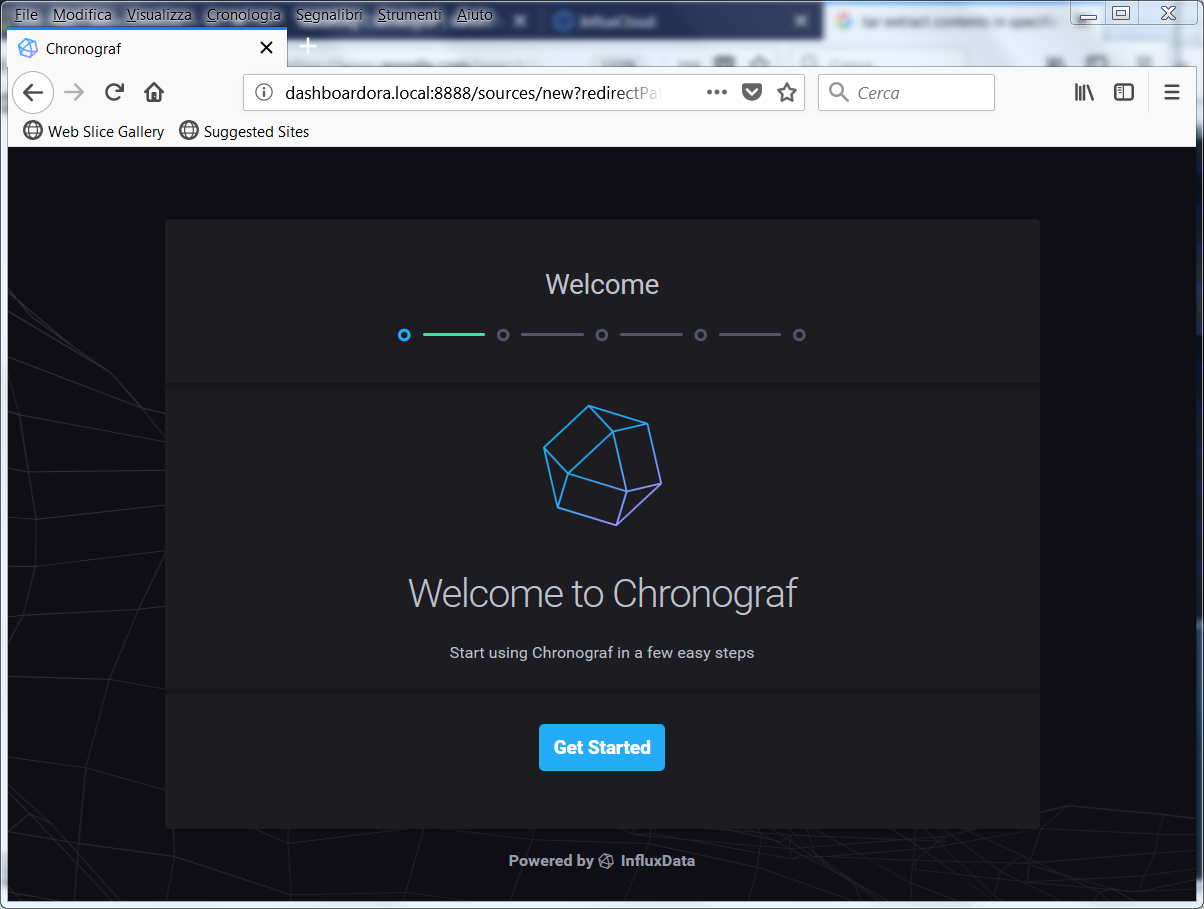
After starting chronograf in one of the ways described above, it can be accessed via browser and port 8888

http://dashboardora.local:8888

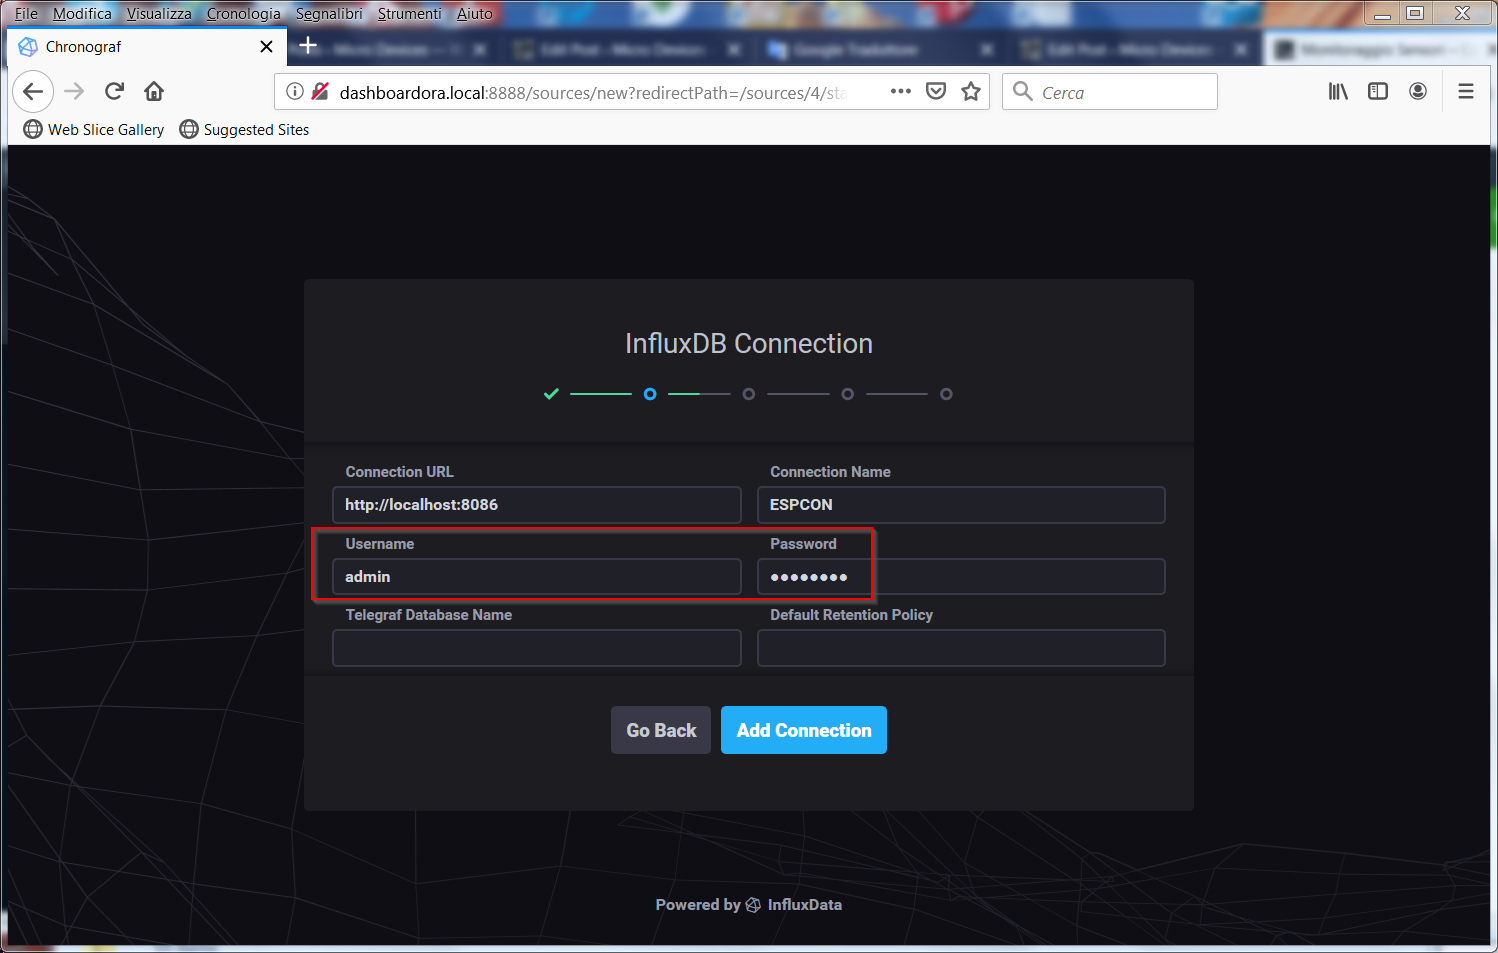
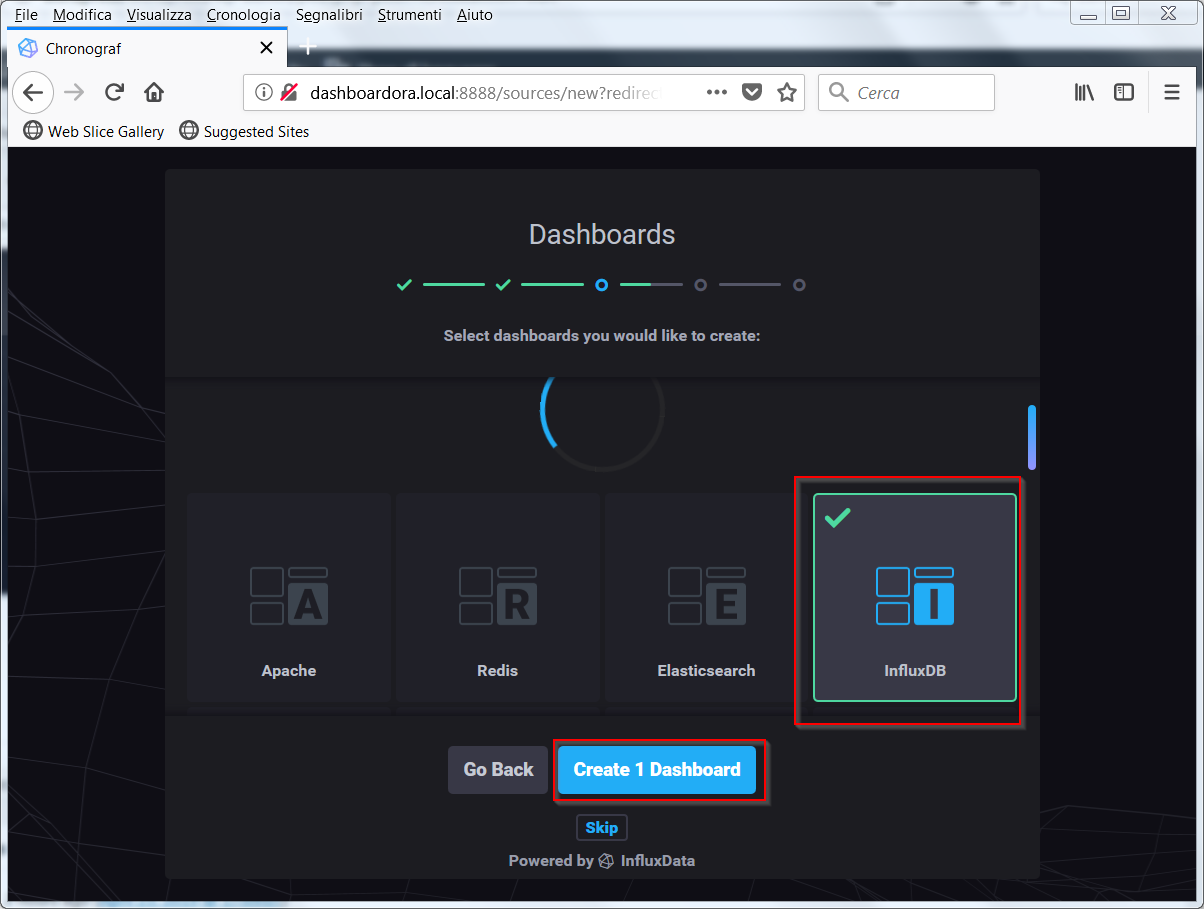
ChronografPress Get Started and set the connection and the credentials of the admin user with relative password defined before

Chronograf2conSet up the Influxdb dashboard

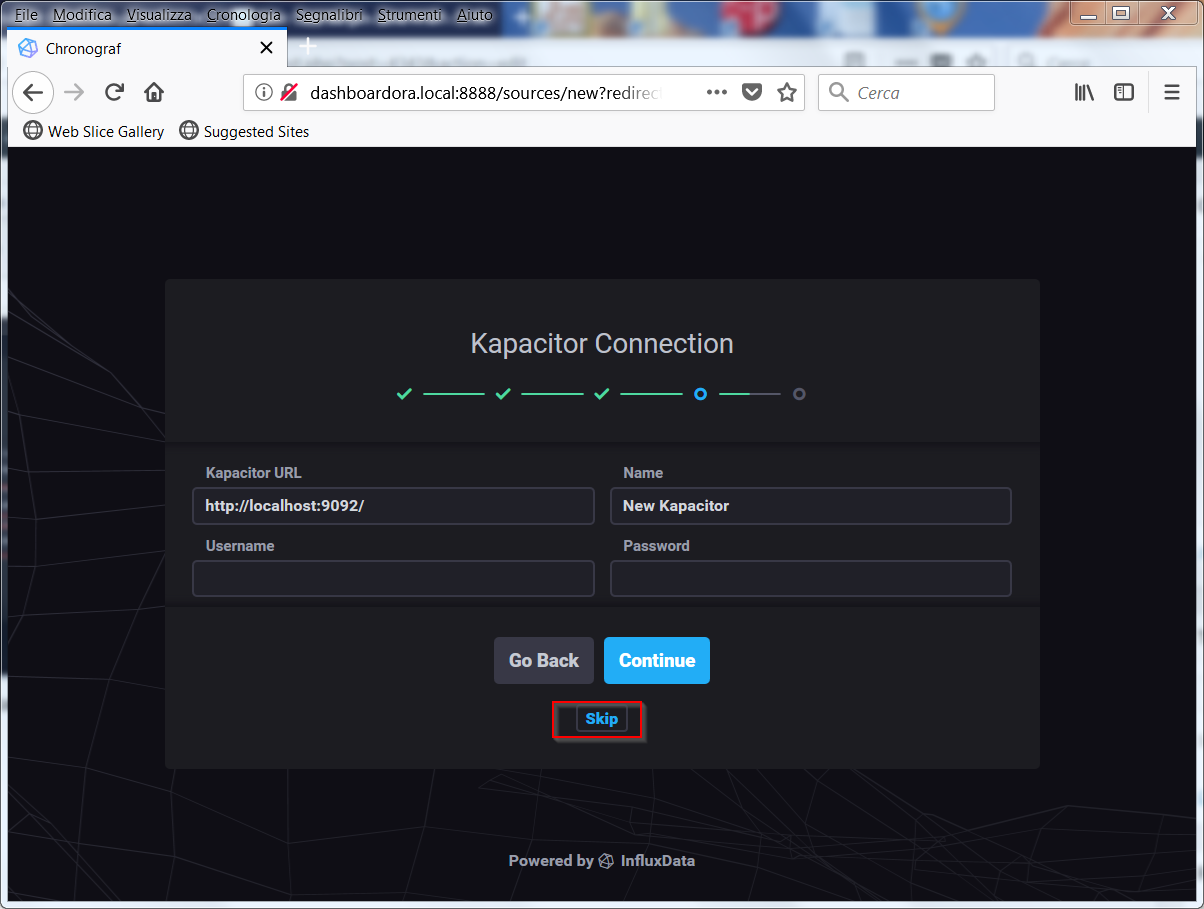
ChronografDashboardDo not set the Kapacitor component

Chronograf3Complete the configuration and by clicking on View All Connections

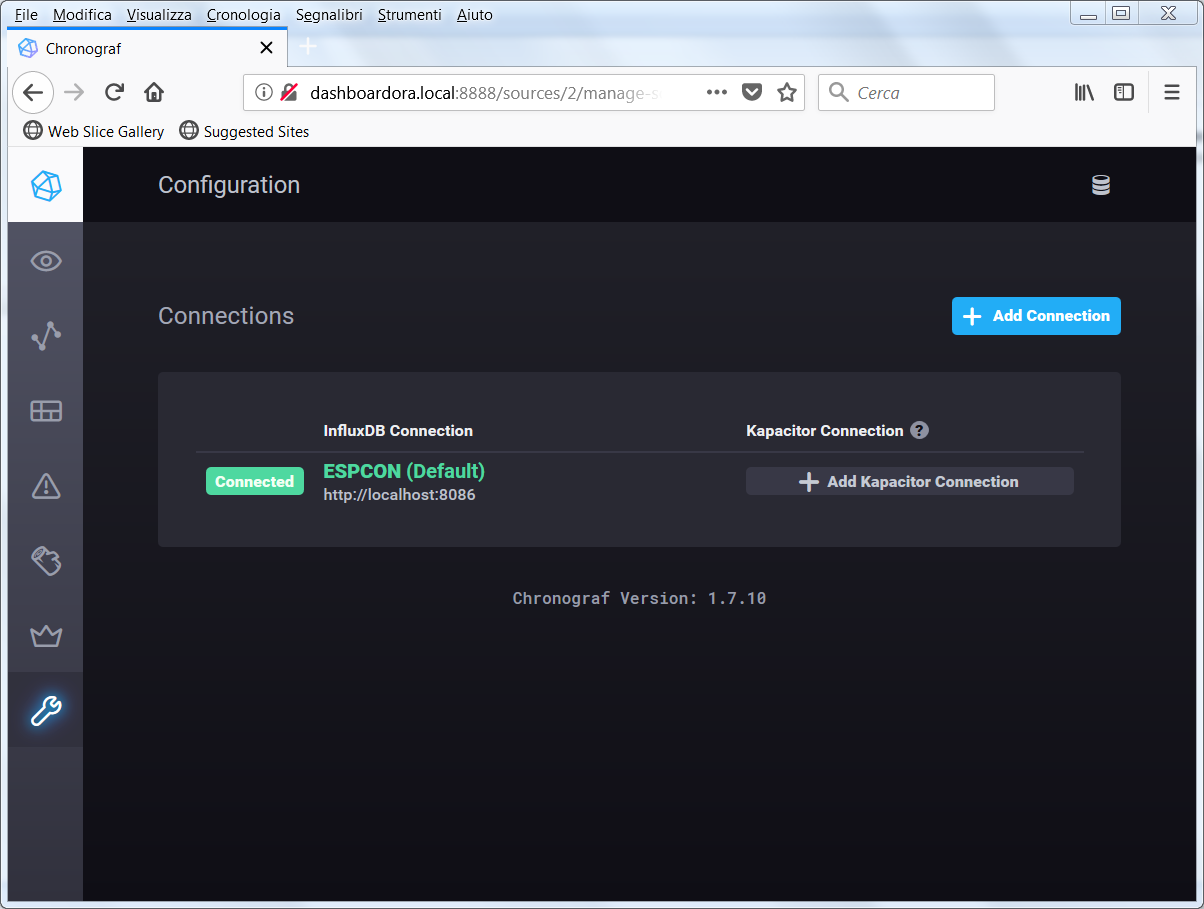
Chronograf4we access to the newly created connection

ChronografConnections

This component can be useful later to manage and monitor InfluxDB.

In the next article, we ‘ll define the rules on Nodered to populate MySql and InfluxDB databases with the data sent by the sensors

Sensors Monitoring – Nodered Configuration


Sensors Monitoring – MySql Configuration

After the software installation on Orange Pi PC we proceed to the their configuration

Sensors Monitoring – Envinronment Setup 2

Creating Tables on MySql

On MySql 3 tables have been created containing the values of temperature, humidity and pressure of the sensors.

Here is the MySql model

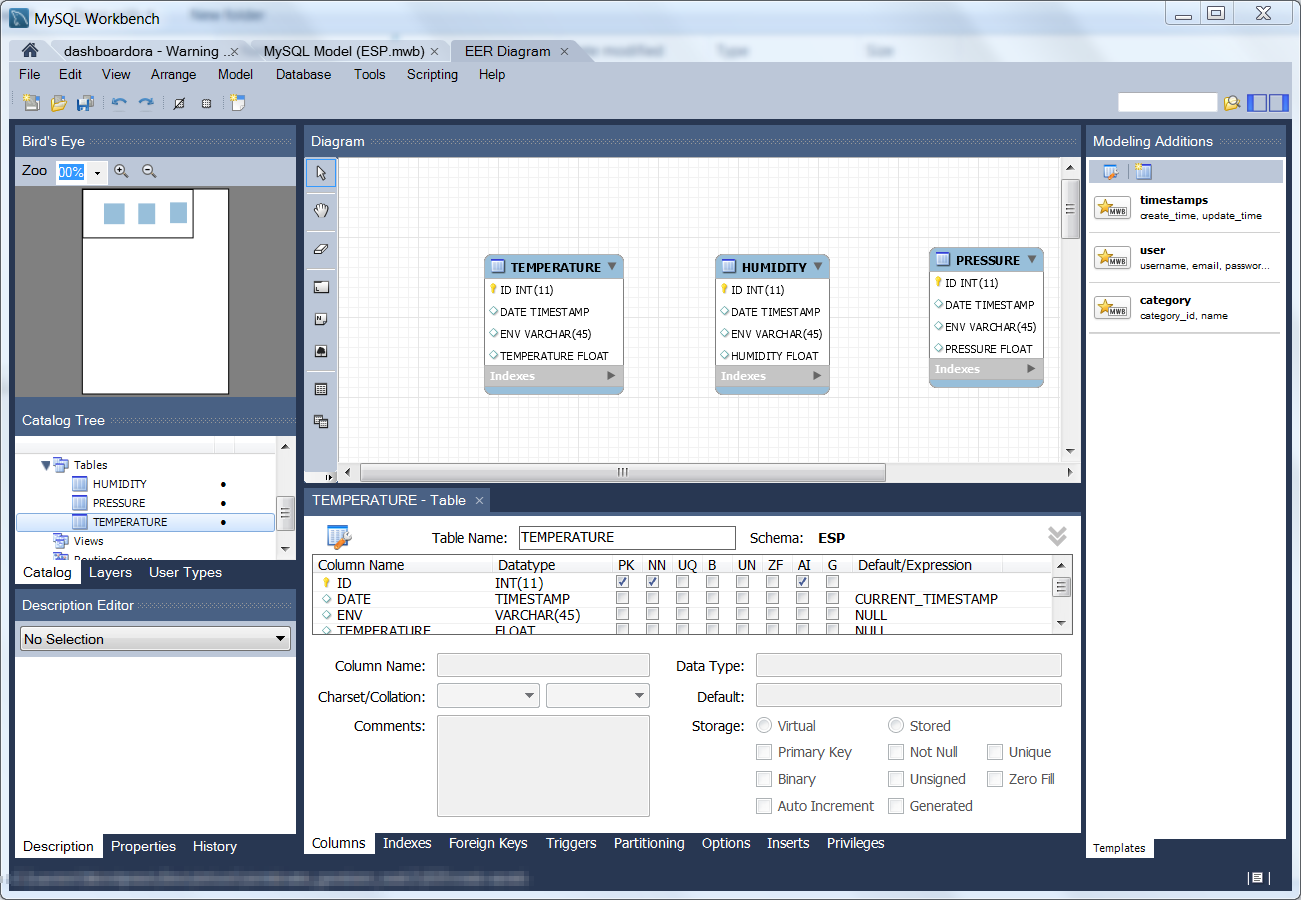
MySql Model

to import into MySql Workbench

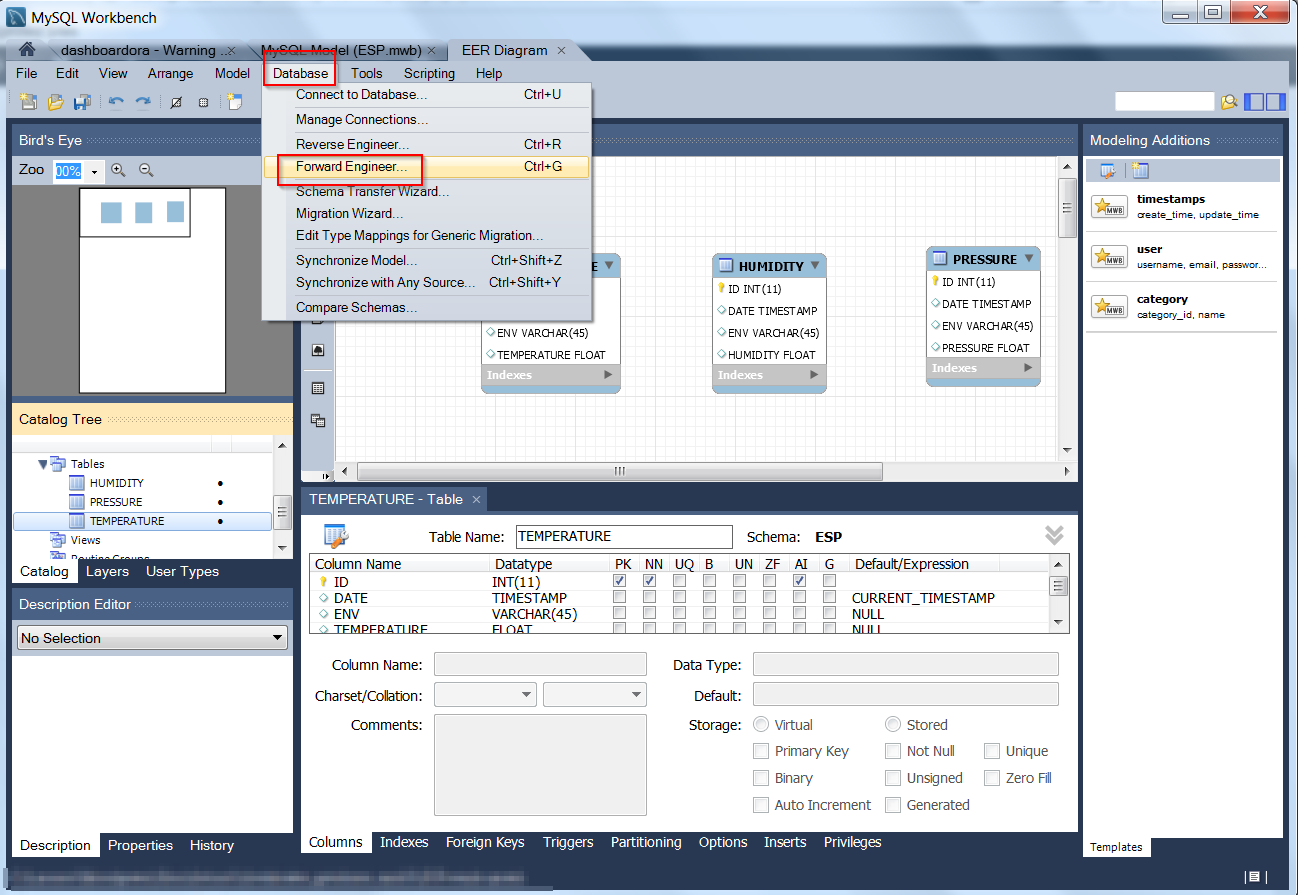
ESPModelloOnce imported, access the Database-> Forward Engineering menu and import the tables on your MySql system on the Orange Pi PC, by entering the MySql root user and relative password

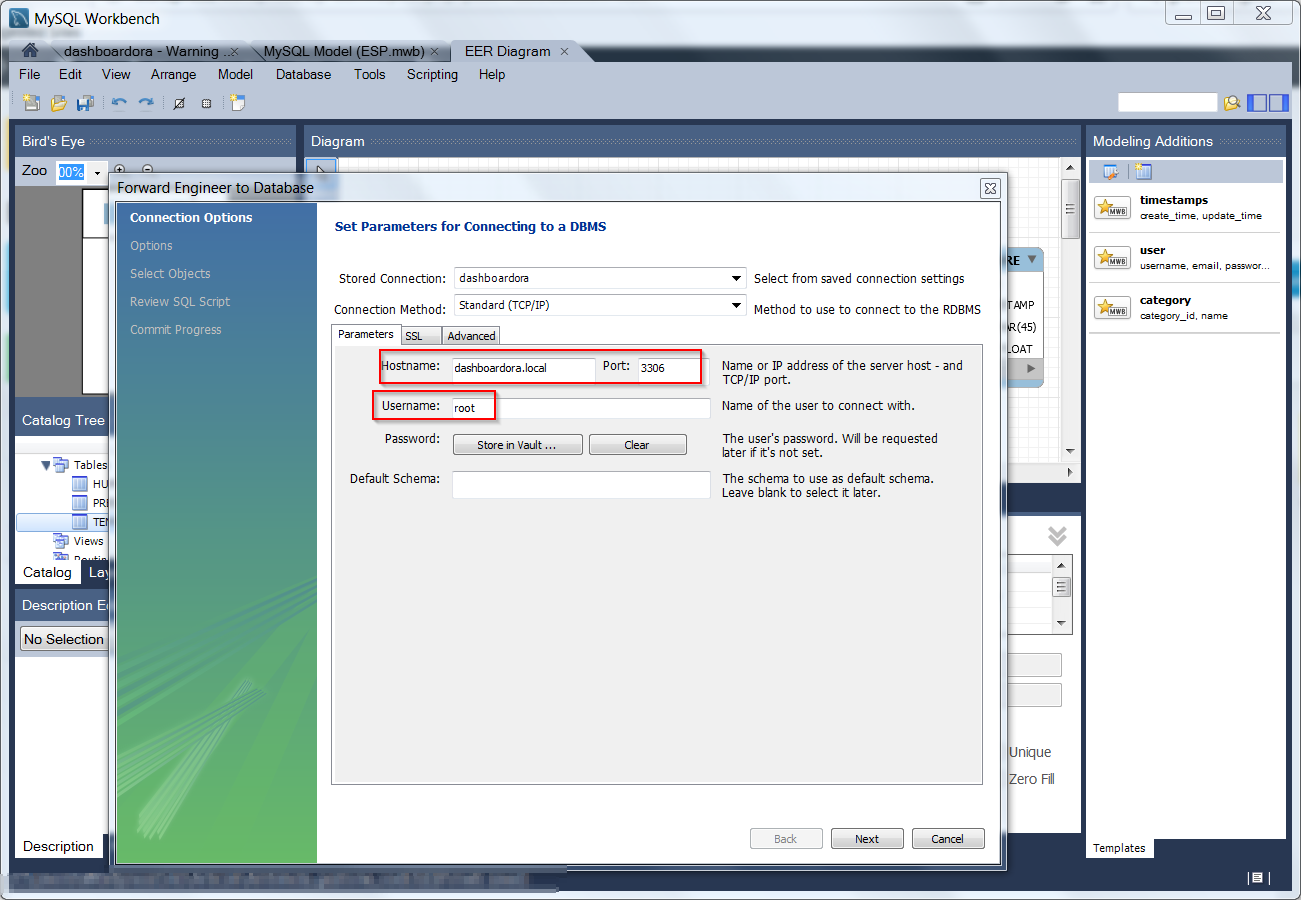
ESPImportAt the next screen we  use the connection created on MySql Workbench to connect to the database

ESPImport1Leave everything by default and enter the root password when prompted.

The tables are now available on the database

ESPTablesIn the next article we configure InfluxDb to store data in real time sent by the sensors

Sensors Monitoring – InfluxDB Configuration

Sensors Monitoring – Envinronment Setup 2

After the software components installation in the previous article

Sensors Monitoring – Eninronment Setup

we finish this operation with this article.

Infludb

The Influxdb is installed as indicated in the link

Influxdb

For Debian 9 we execute the following commands

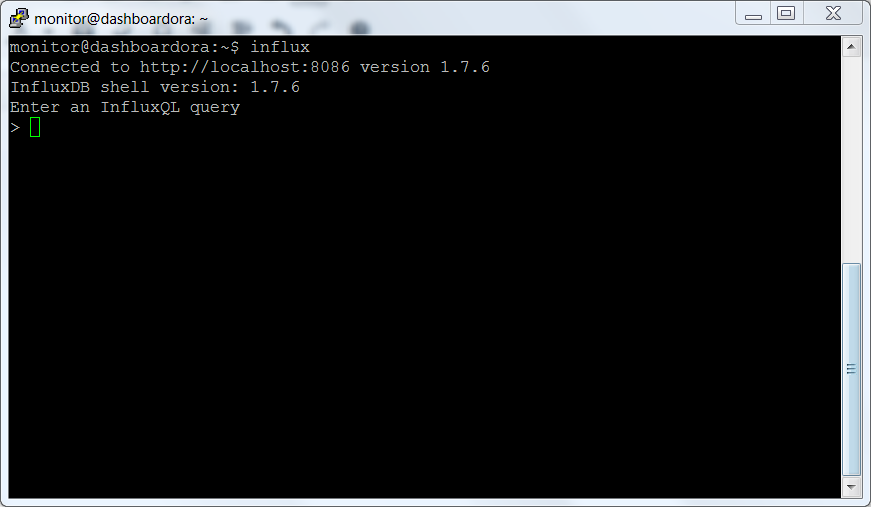
Check that everything works correctly by connecting with the infludb client

infux

Nodered

We proceed to the installation of node.js

Then we proceed to  nodered installation, as indicated at the link

Nodered installation

To run nodered at the start up, we use the script available at the following link

Nodered autostart

We did not run the automated script, but executed the following steps

Edit /etc/init.d/nodered and change the user from pi to monitor, ie change the parameter

in

Run

Start  nodered

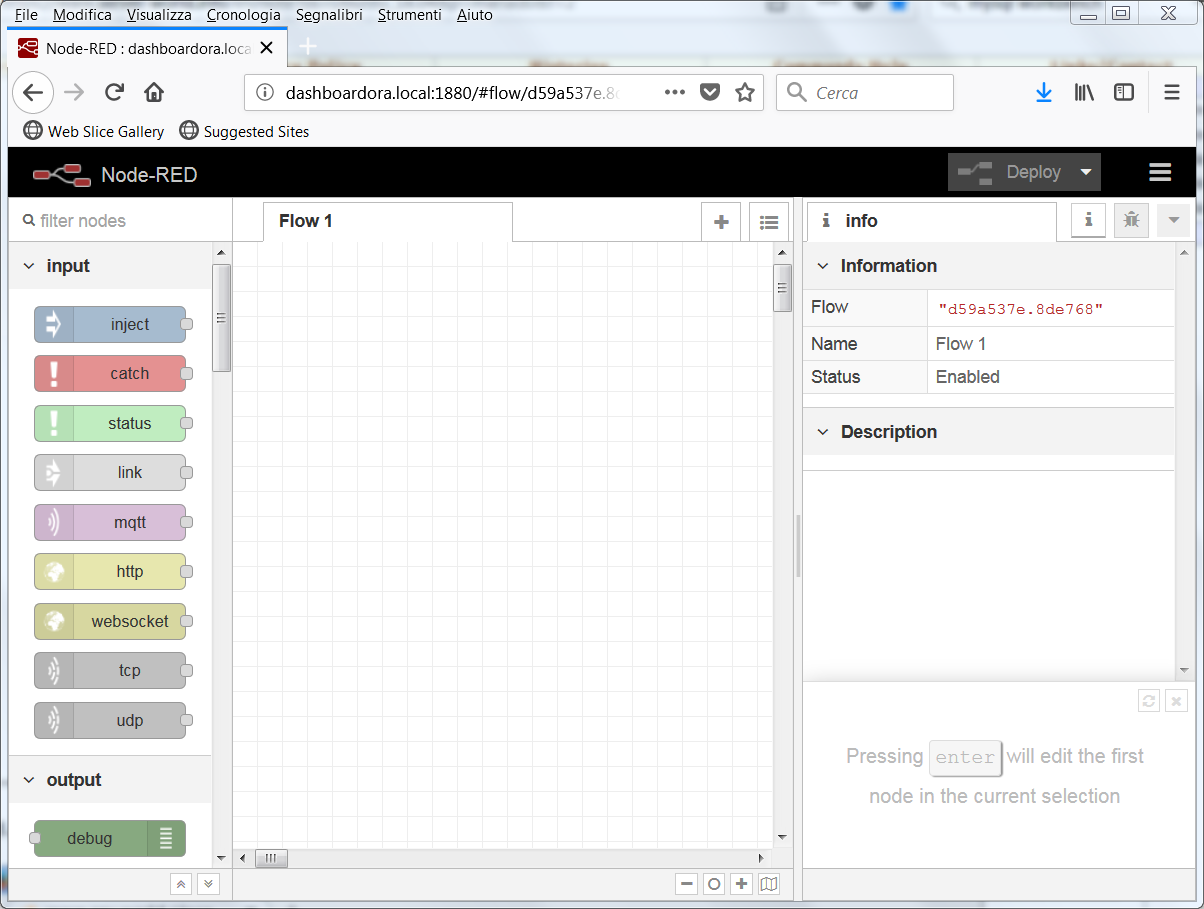
Check that nodered works by accessing the following link with the browser

http://dashboardora.local:1880

nodered

Restart the system and check that nodered starts automatically.

Proceed to the installation of the nodered add-ons


Grafana

We proceed to download the version for arm

Grafana for ARM

Enable and start Grafana

Access the system using the url

http://dashboardora.local:3000

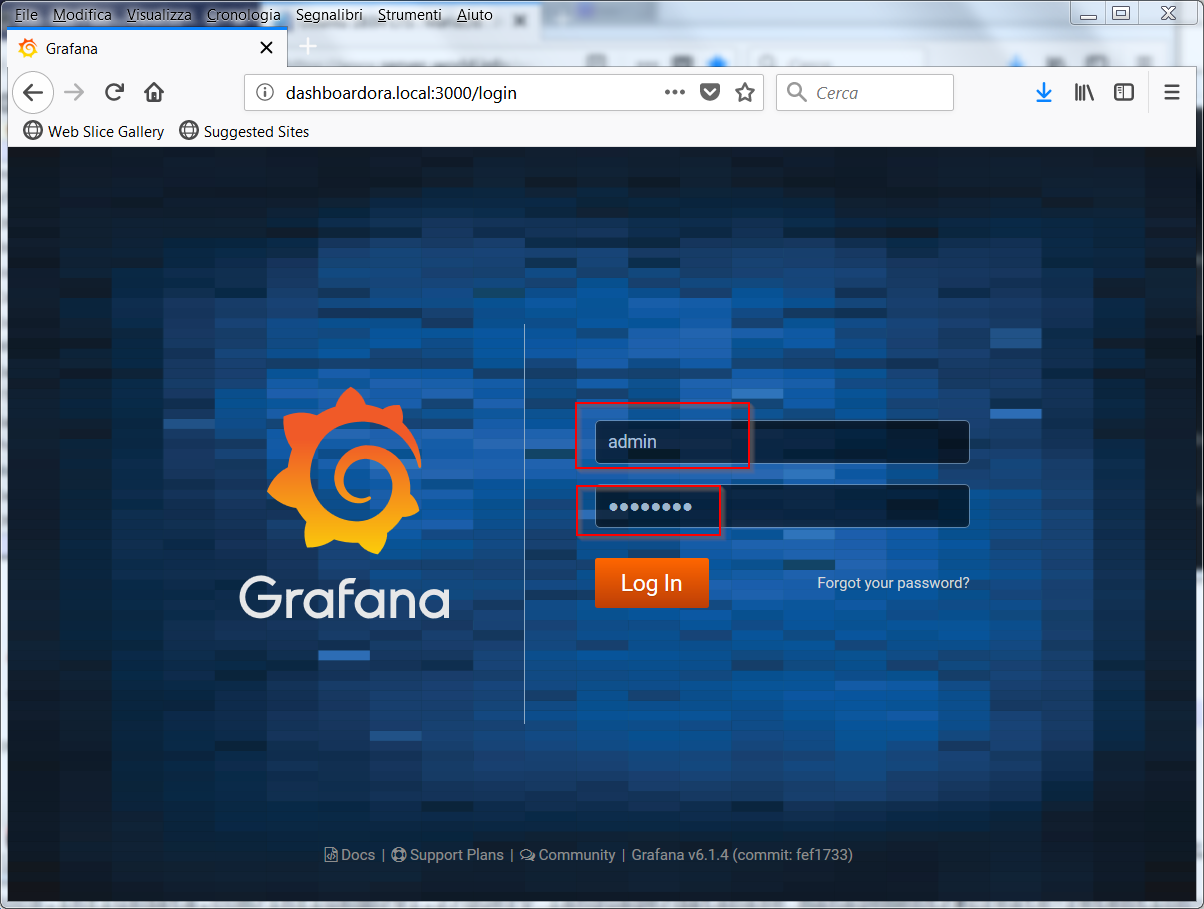
Log in with the user admin and password admin; change the password

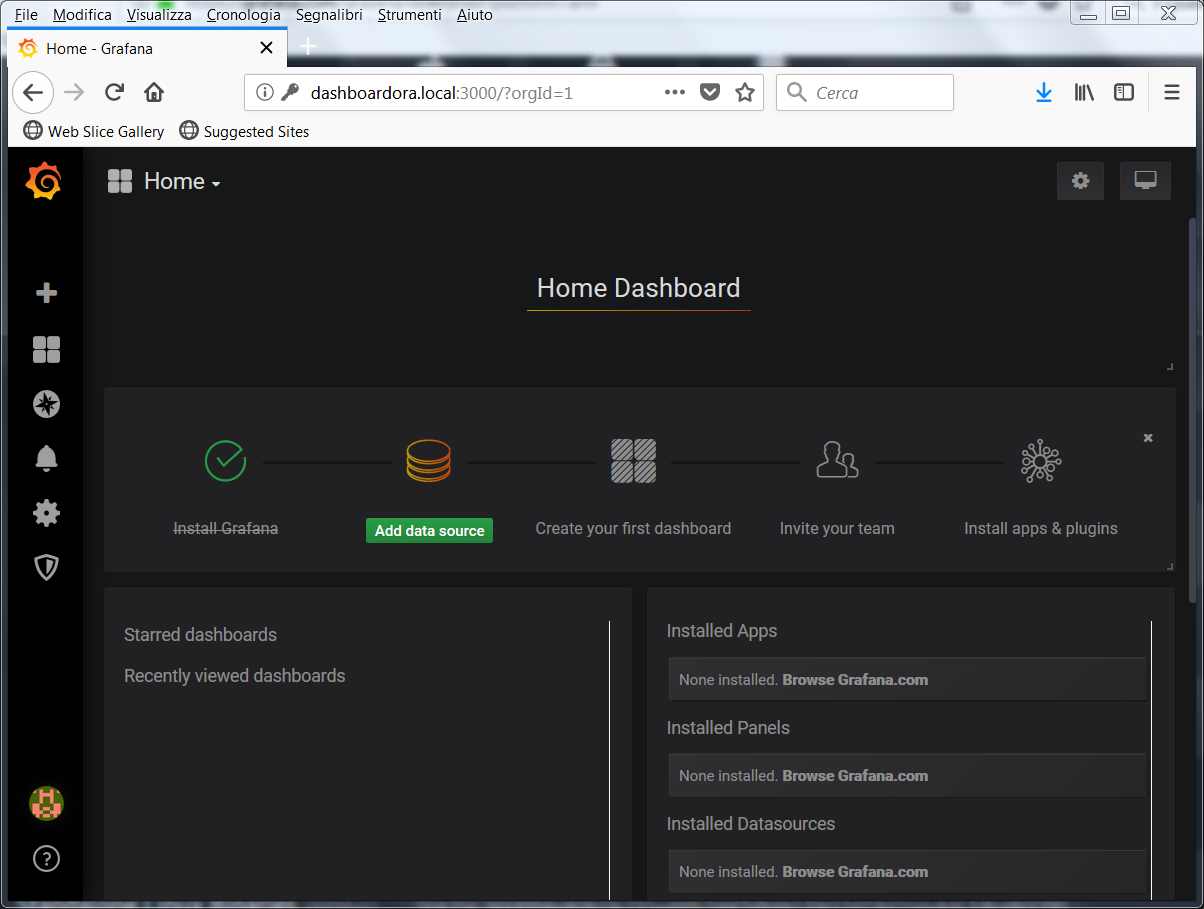
GrafanaOnce the new password has been set, the setup interface is available

Grafana2In the next articles we will execute the settings to be able to view the sensors data.

Reverse Proxy installation

To access the system through port 80 of the http server we use nginx as a reverse proxy

nginx

We disable apache

We proceed to the installation of nginx

Everything must be configured to access the two systems using the following links

http://dashboardora.local/nodered for nodered

http://dashboardora.local/grafana for grafana

For Grafana we follow the official documentation

Grafana proxy

We change the file /etc/grafana/grafana.ini by modifying the domain and root_url parameters; in our file the parameteres are modified  as follows
Then we configure nginx, creating the servizi file with the following contents in the /etc/nginx/sites-available folder
Here is the link of the nginx configuration

nginx configuration

We run the following command

and start nginx and grafana services

At this point it is possible to access the two services via the links

http://dashboardora.local/nodered

nodered-nginx

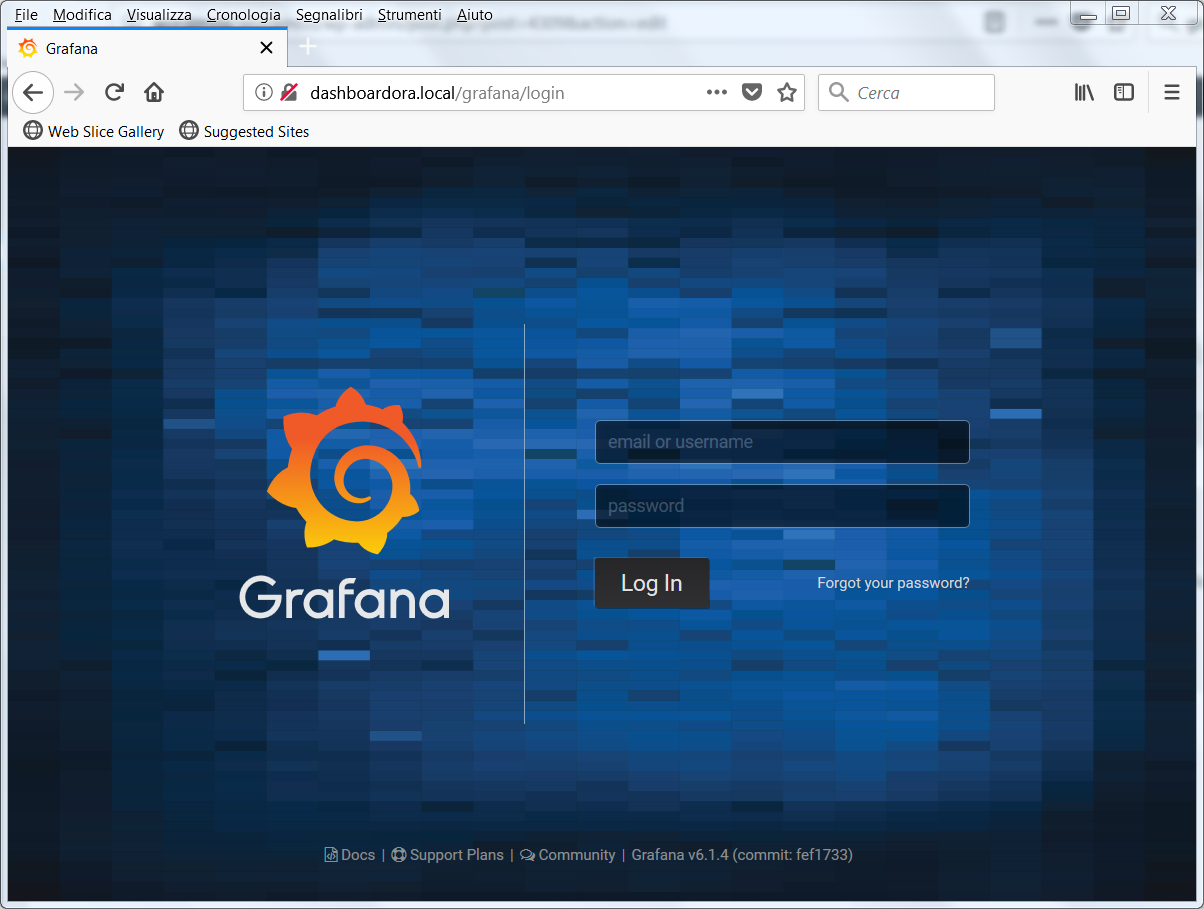
http://dashboardora.local/grafana

grafana-nginxIn the next article we start the configuration of the various modules needed for the sensors monitoring

Sensors Monitoring – MySql Configuration

Sensors Monitoring – Envinronment Setup

In setting up the infrastructure for monitoring sensors made up of ESP8266 devices in previously published articles

Mqtt with Beaglebone ed ESP8266 – Freeboard

Freeboard had been set up to display the data coming from the sensors.

In this new series of articles, we  set up Grafana

Grafana Dashboard

as  environment to view the data of the various sensors.

We implement the environment, in this case,  on an Orange Pi PC board, but other arm or pc system can be used.

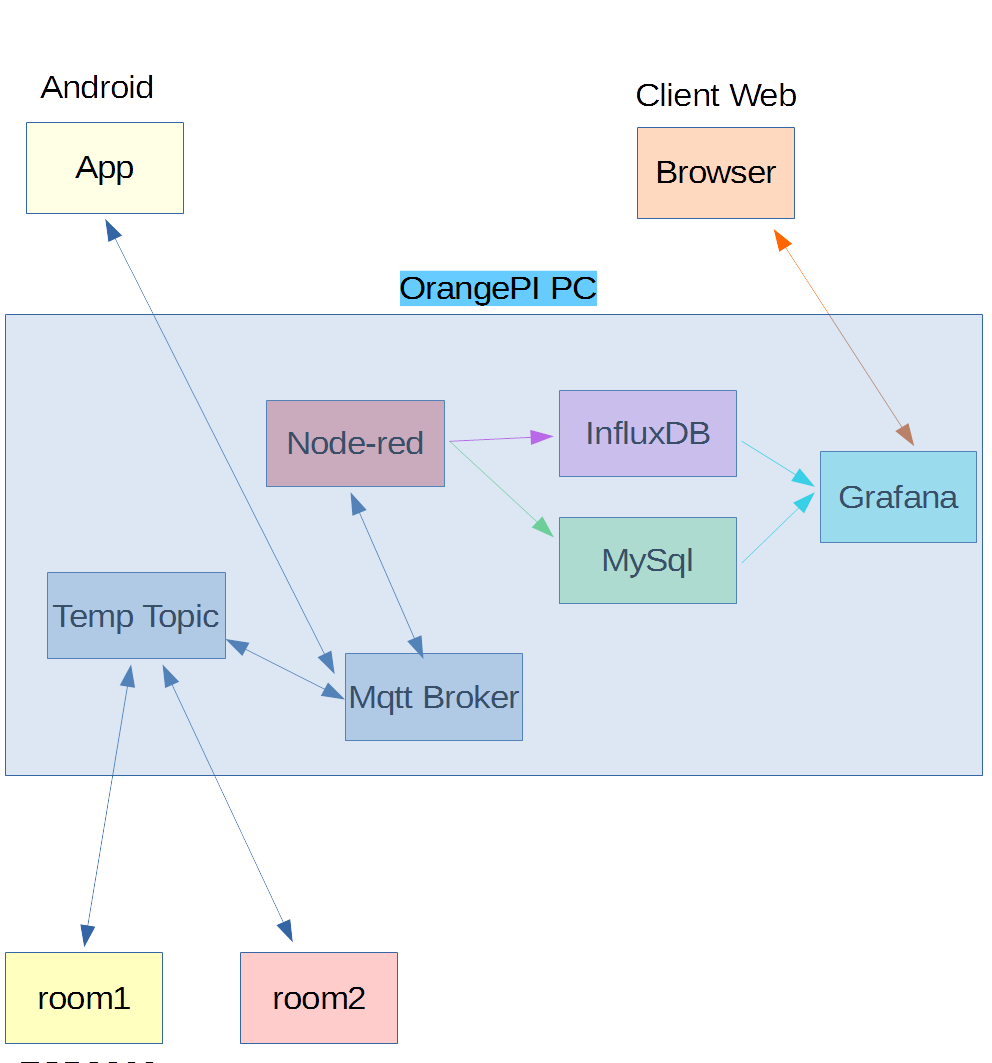
Below the architecture used in this series of articles

archGrafana

In these articles we’ll use the maximum authorizations for each environment, we will not use authorizations on mosquitto and no encrypted connections will be used. In a test environment this setting is fine, but in an operating environment it is necessary to set up the correct authorizations and possibly the encryptions in the connections in all environments.

We have installed our compiled version of Debian 9 Stretch for Orange PI PC. The image used is the following

Image Download

The monitor user was created during the Image setup, while the hostname was renamed in dashboardora. If not installed proceed to install the avahi daemon

In this way the services can be accessed by publishing the hostname, i.e. dashboardora.local.

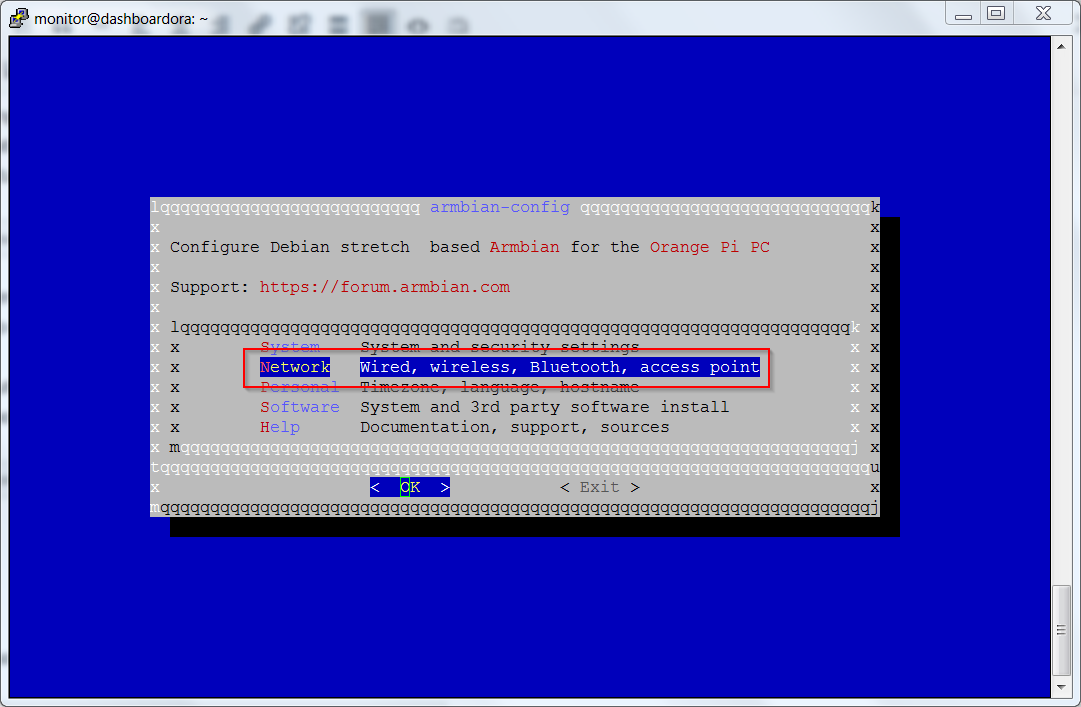
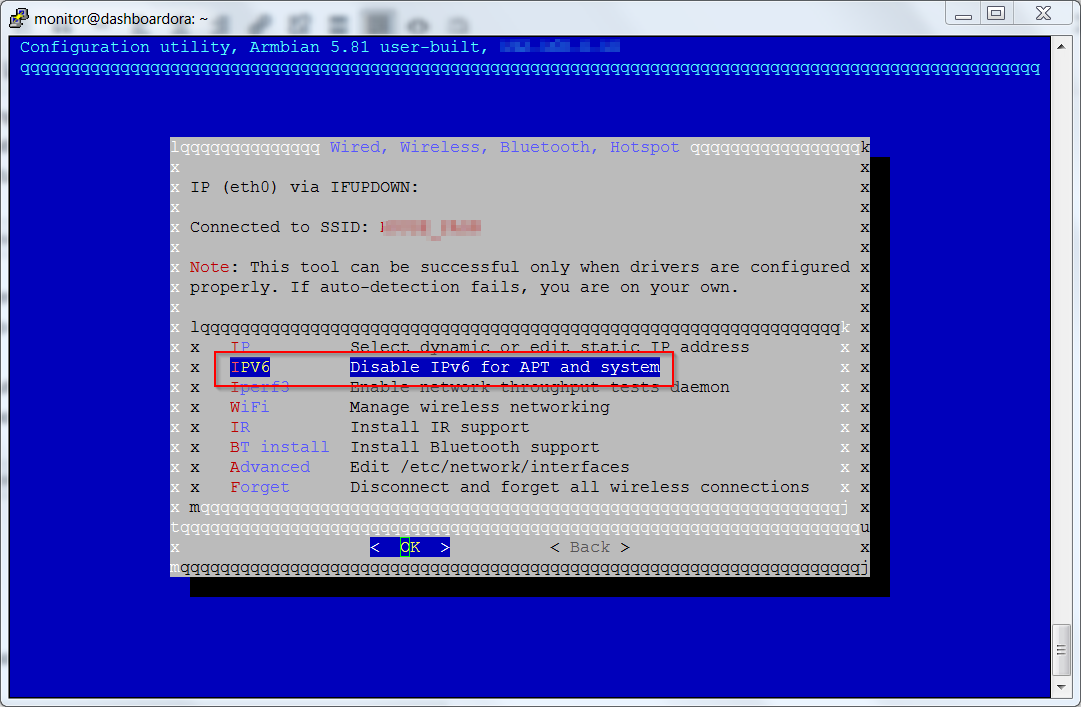
Using the armbian utilities  disable ip6 on the system; to carry out this setting launch armbian-config

ipv6Disable1Proceed to diasble IPV6

ipv6Disable2

As a first step we install the  mqtt broker mosquitto

Install the http services and the databases Mysql and MySqlWorkbench

Apache2

and various prerequisites

Start apache

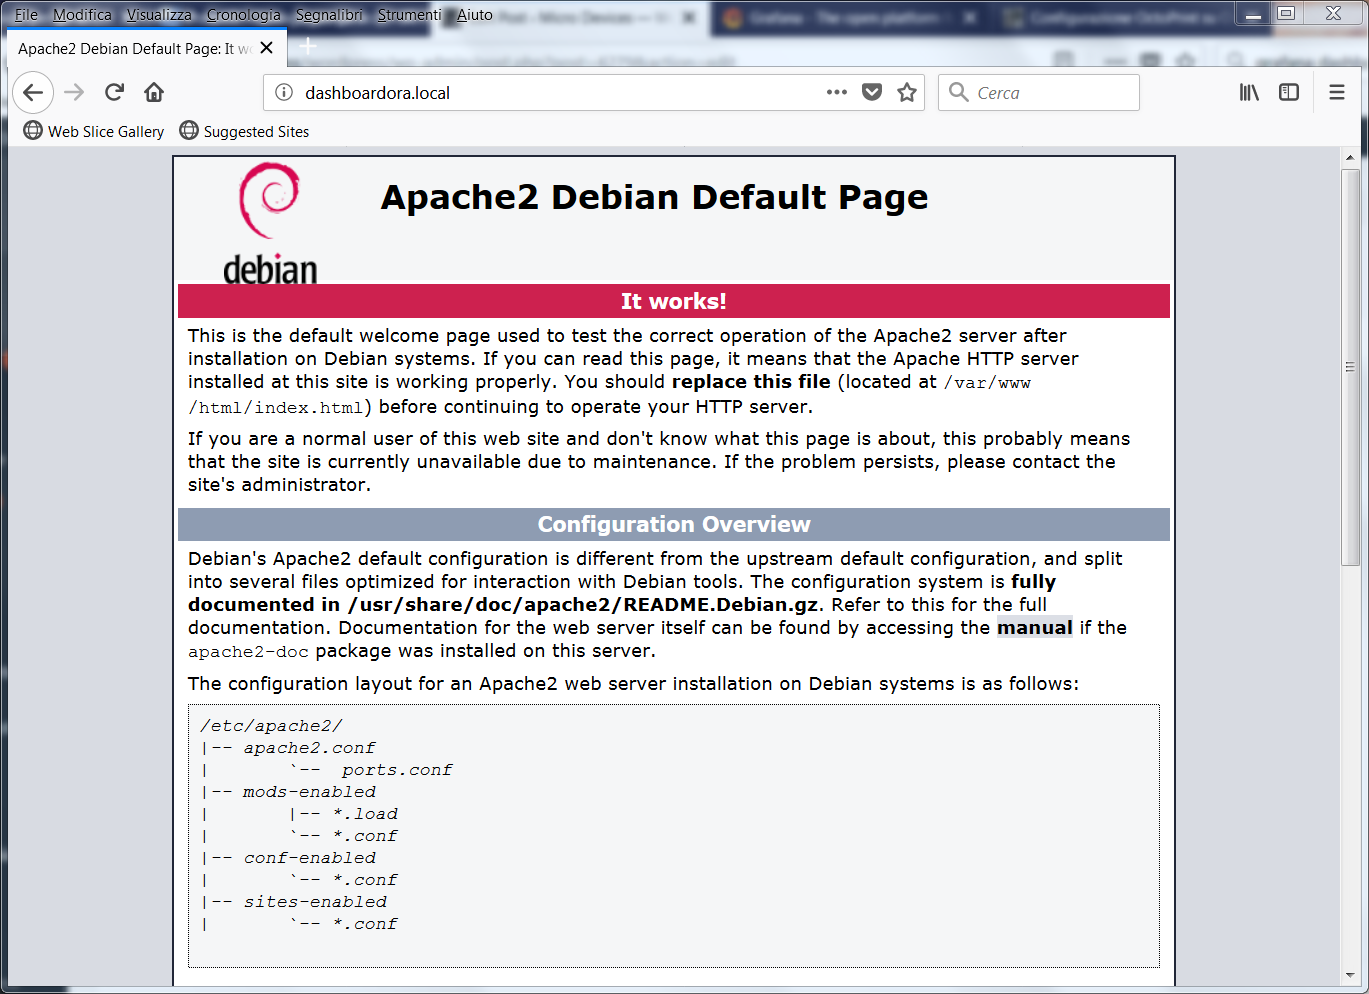
and check that the server responds to the web address, which in our case corresponds to http://dashboardora.local

apache

MySql

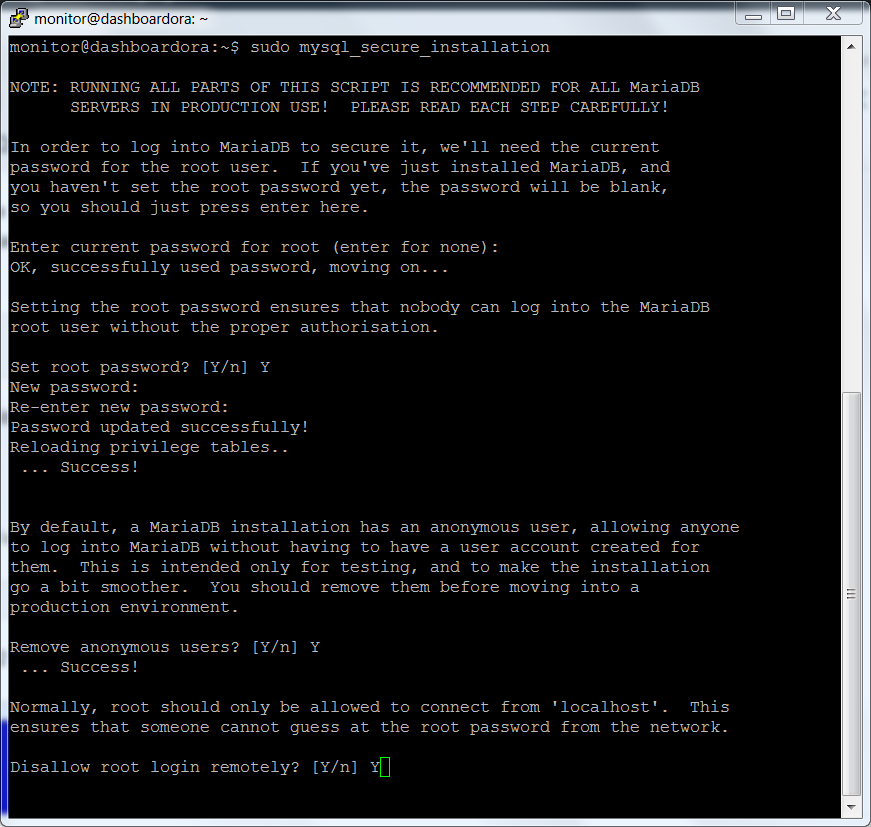
Debian 9  comes with MariaDB; you must set the password for the database administration user root with the following command

We set the root password and the ability to log in from other hosts as root

mariadb-secureThe other chosen options are listed below

mariadb-secure2

We install phpmyadmin for database management

At the next screen choose apache2

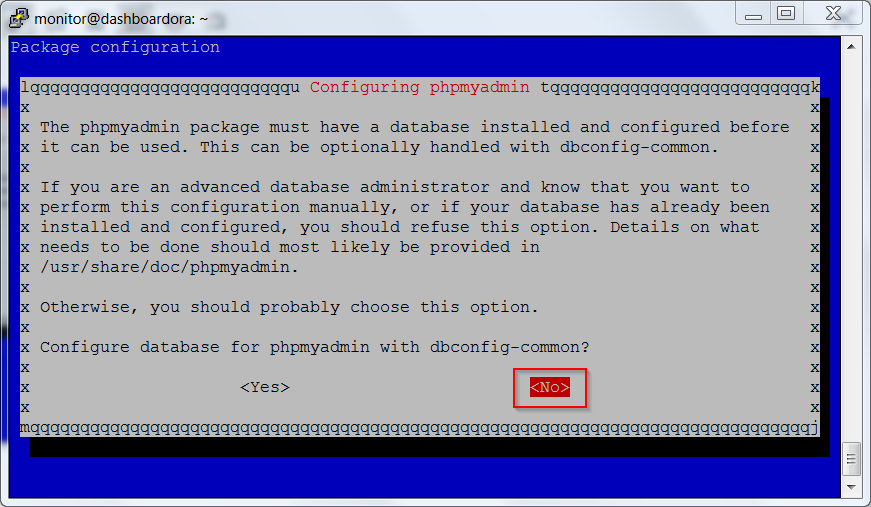
phpmyadminFinally choose NO

phpmyadmin1

Run the commands listed below

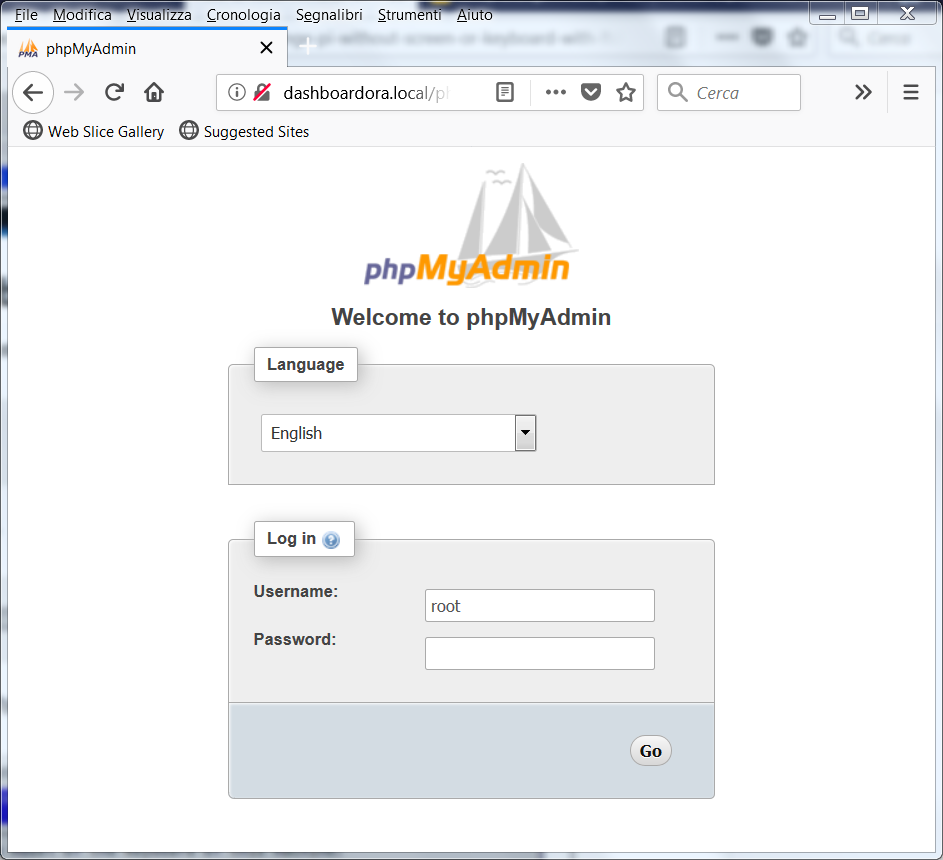
Check that the system works correctly by accessing via web browser by adding to the apache phpmyadmin address, in our case

http://dashboardora.local/phpmyadmin

phpmyadmin2

Log in with the database root credentials.

Mariadb must be enabled to accept connections from other hosts. To do this, go to the folder

and edit the 50-server.cnf file as root, changing the setting

in

To allow the root database user to be able to access from an external client, it is necessary to log on mariadb locally with his client and enable this option; therefore the following is performed


Mysql Workbench Installation on PC

Go to the following link

MySql Workbench

and download the version for your operating system; proceed with the installation.

For Linux the package is also available in the distribution repositories.

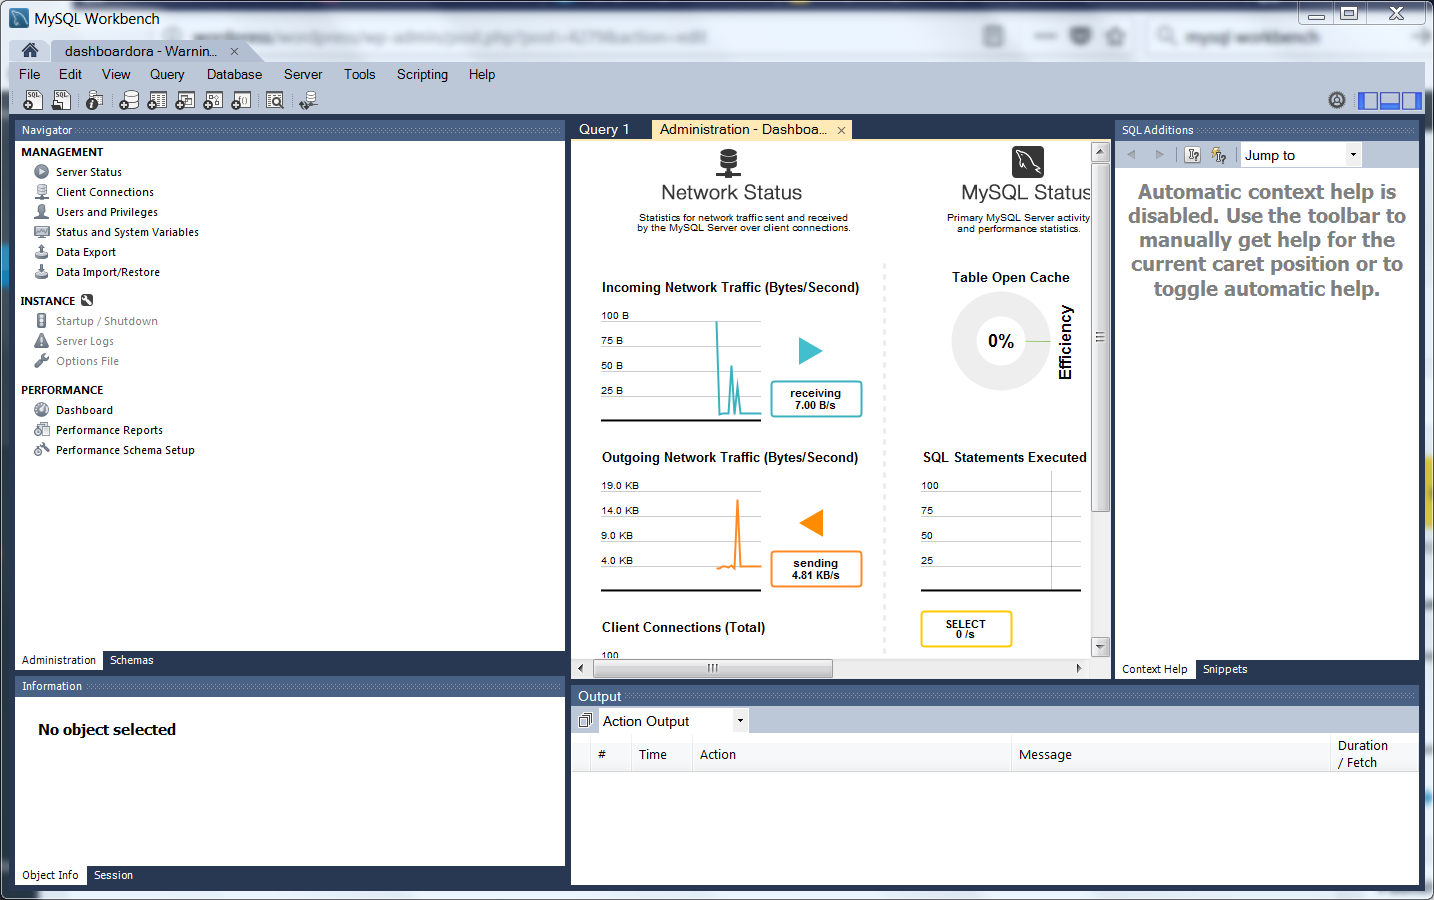
After configuring the connection, you access the MySql system control screen.

MySQLWorkbenchIn the next article we will continue the installation of the other components to be able to monitor the sensors

Sensors Monitoring – Envinronment Setup 2

ESP32 – IDF Sdk with Eclipse

After configuring the IDF development environment in the previous article

ESP32 – IDF Sdk

let’s see now how to use Eclipse as IDE for code development. Instructions are available at the link

Eclipse Setup

Download the  C/C++ Eclipse  for Linux

Eclipse Download

Unpack the file and move it to /opt/

Run ecplise

Set the workspace for eclipse

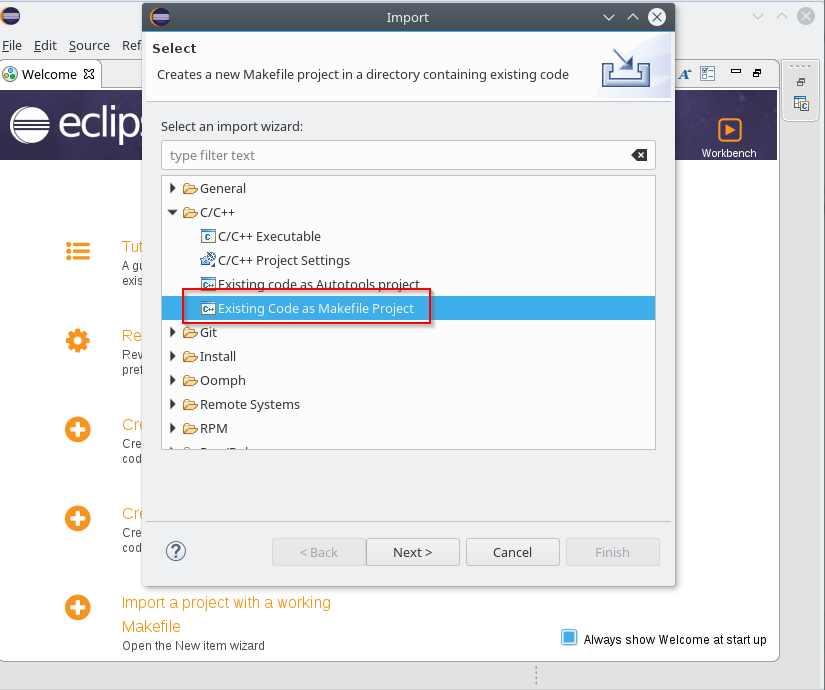
eclipse-workspaceOnce the IDE is open, select File -> Import -> C / C ++ – -> Existing Code as Makefile Project

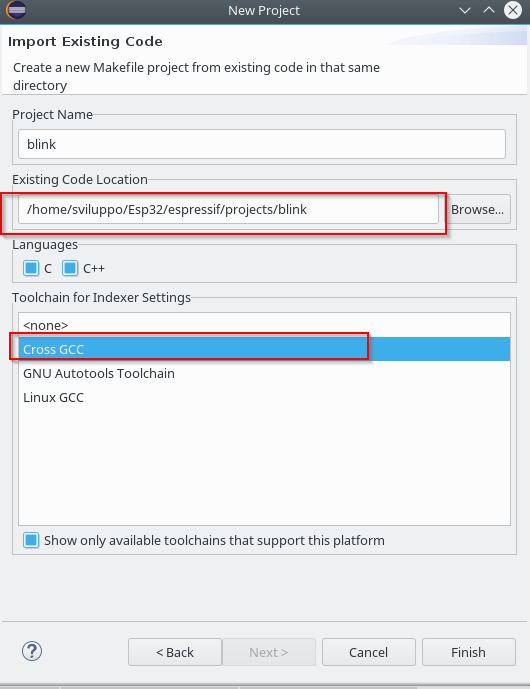
eclipse-importPress Next; on the next screen select the folder containing the Makefile of a sample project in the “Existing Code Location” field and choose CrossGcc as “Toolchain for indexer settings” as shown below

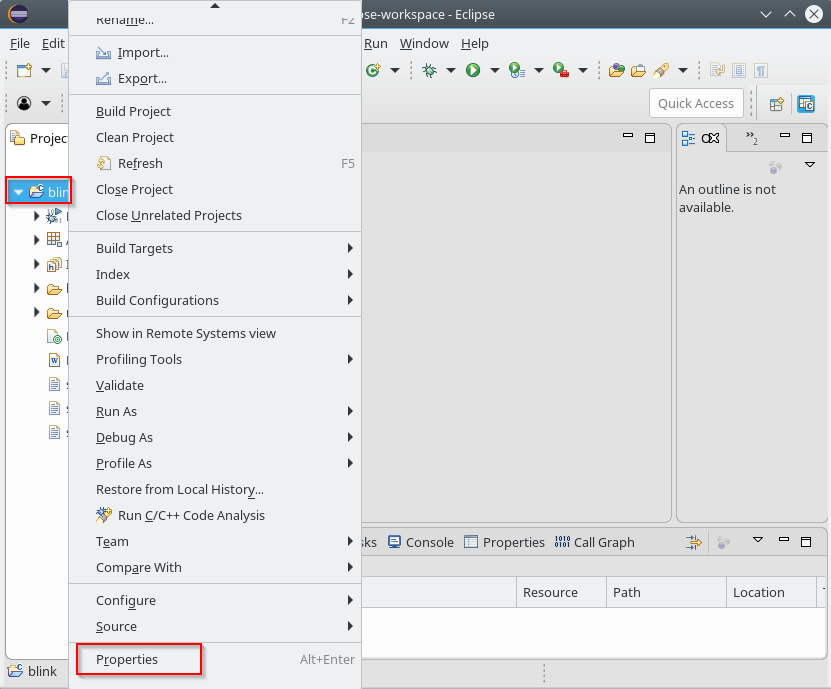
eclipse-import2Once the project is loaded, using the mouse right button on the project name, select the properties option

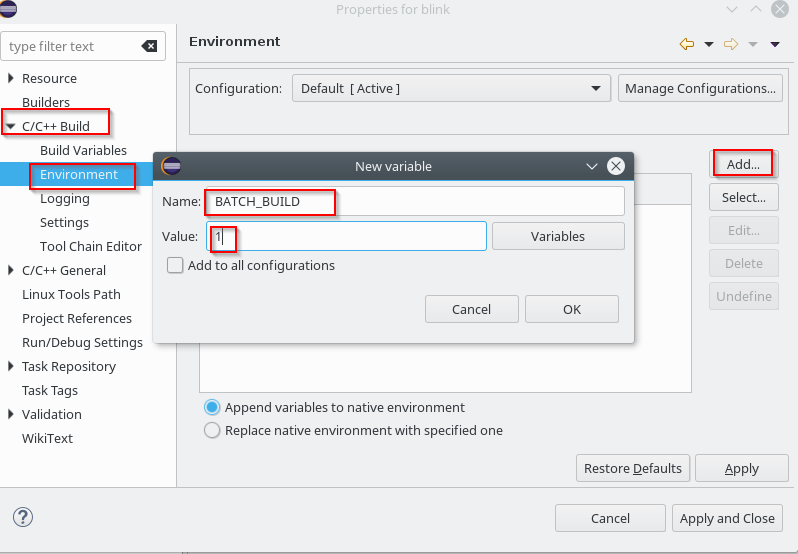
eclipse-project-propertiesUnder C / C ++ Build -> Envinronment add the variable

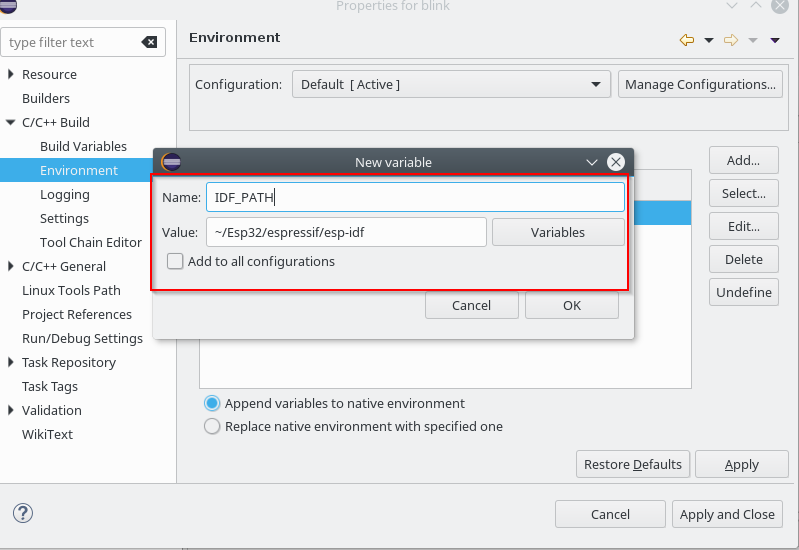
eclipse-batchAdd the IDF_PATH variable pointing to the downloaded IDF SDK in the same section

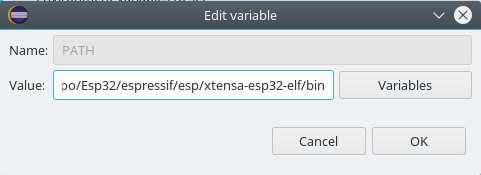
eclipse-idf-pathEdit the PATH variable and add the path to the bin folder of the cross compiler /home/sviluppo/Esp32/espressif/esp/xtensa-esp32-elf/bin

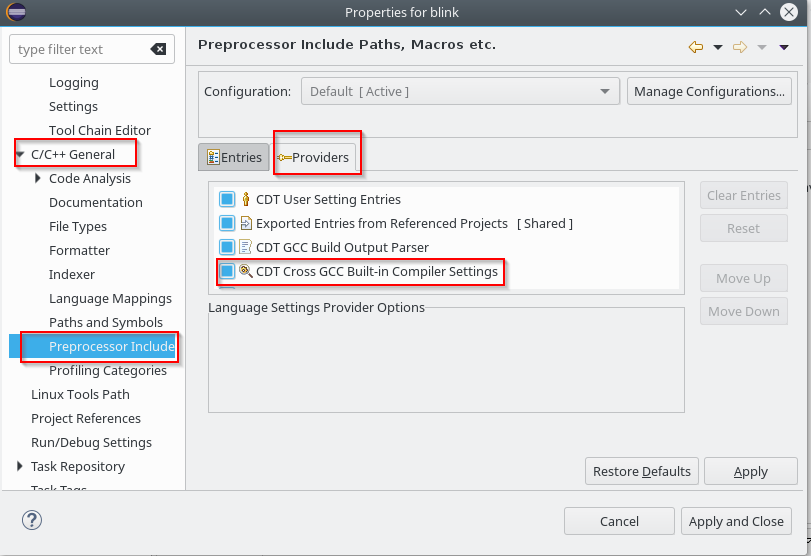
eclipse-pathAccess “C / C ++ General” -> “Preprocessor Include Paths”; choose the Providers tab and click on “CDT Cross GCC Built-in Compiler Settings”

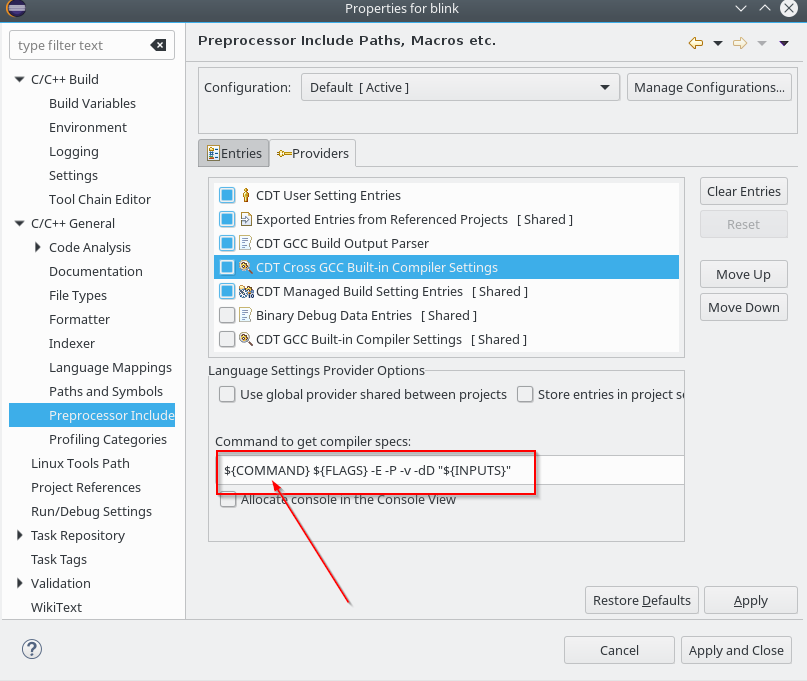
eclipse-cross-cdtReplace $ {COMMAND}

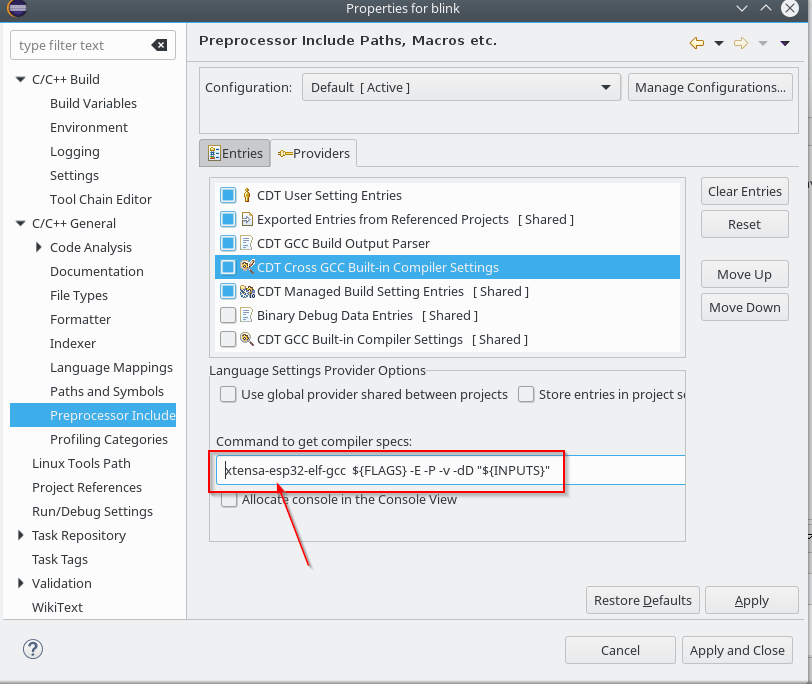
eclipse-cross-cdt1with xtensa-esp32-elf-gcc

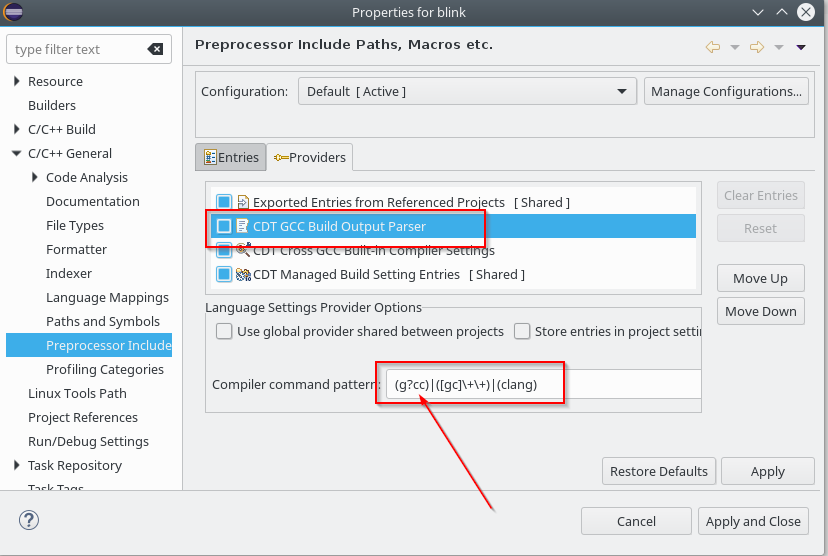
eclipse-cross-cdt2Choose now, always in the providers section,  “CDT GCC Build Output Parser”

eclipse-cross-cdt3and insert at the beginning of the “Compiler command pattern” xtensa-esp32-elf-

eclipse-cross-cdt4Save the configurations.

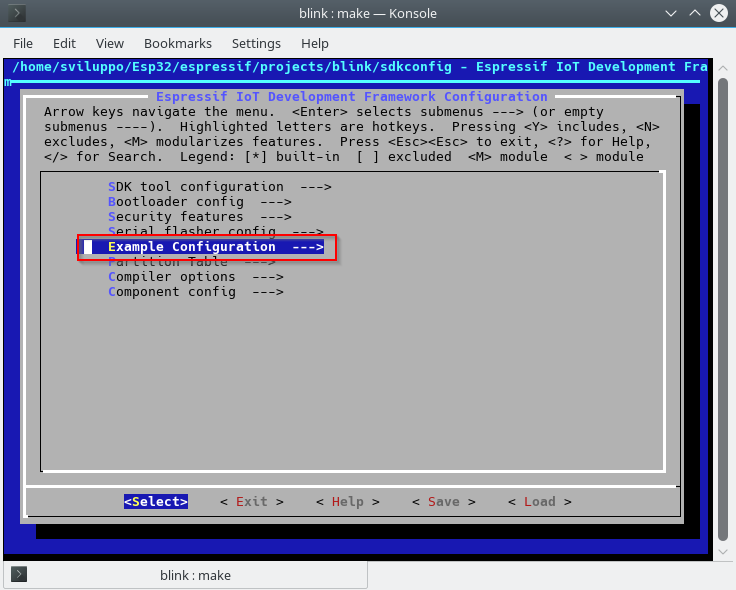
The project settings should always be made by make menuconfig in the unix shell. Access the shell and set the LED to be switched on/off  the value 2 as GPIO; this is because in our case the card is a doit whose design is illustrated in this document


Access to Example configuration

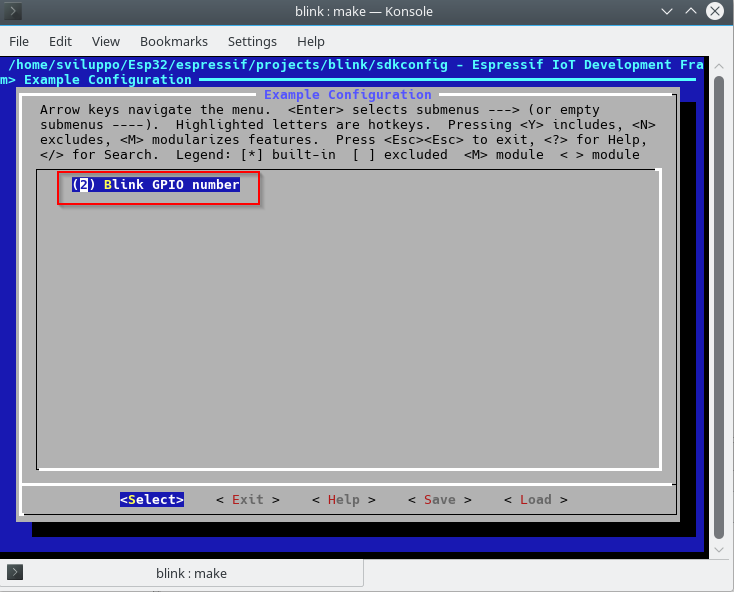
blink-configurationand set the gpio value to 2

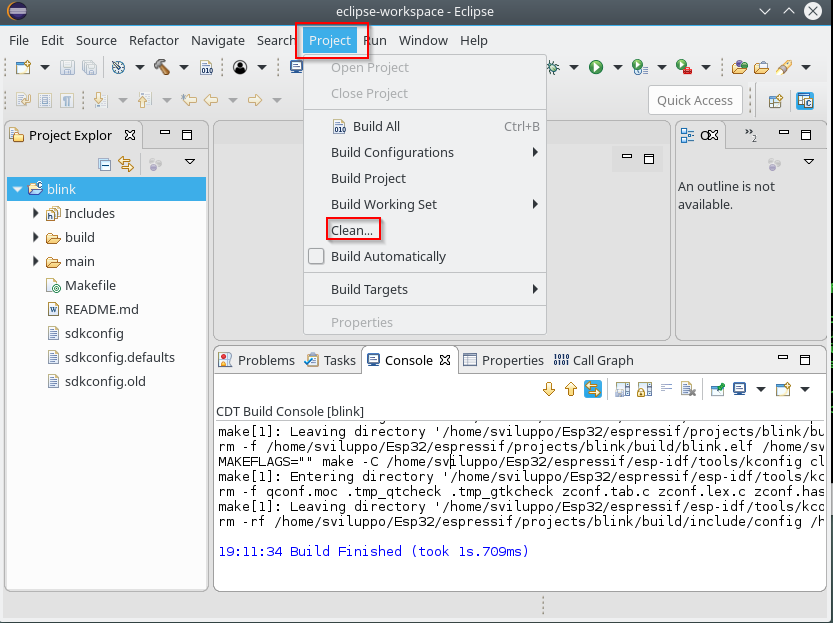
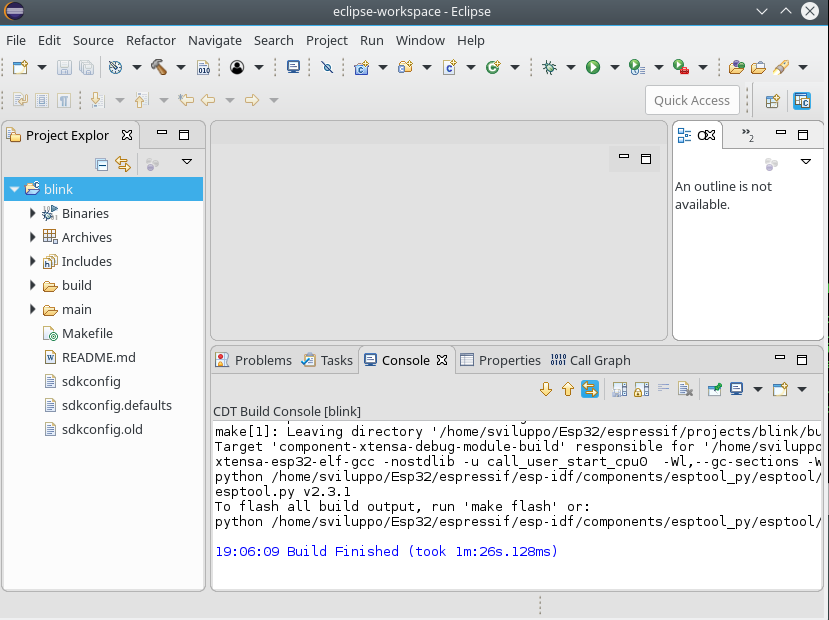
blink-gpioSave the configuration. Go back to Eclipse and proceed with cleaning with

eclipse-clean-blinkand subsequent compilation with Project -> Build

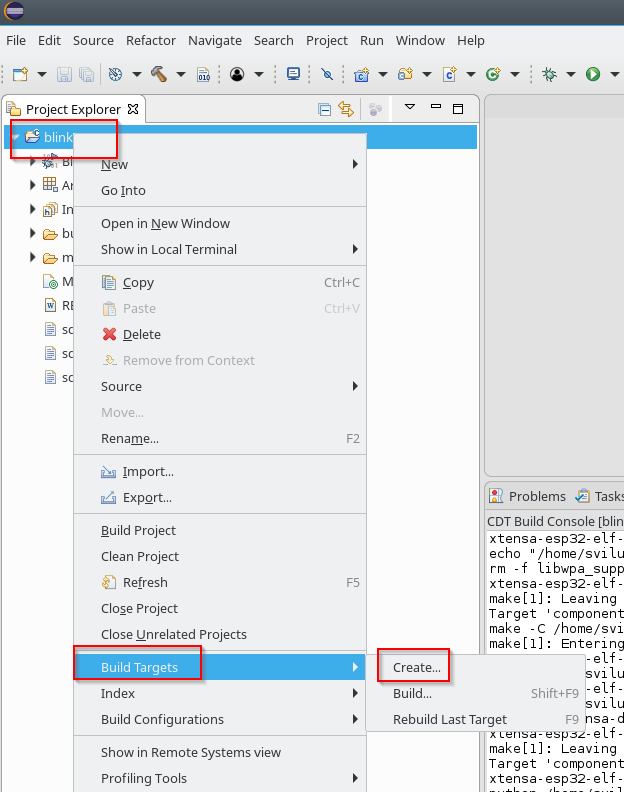
eclipse-build-blinkTo run firmware flash from eclipse;, select the project and with the right button choose Build Targets -> Create …

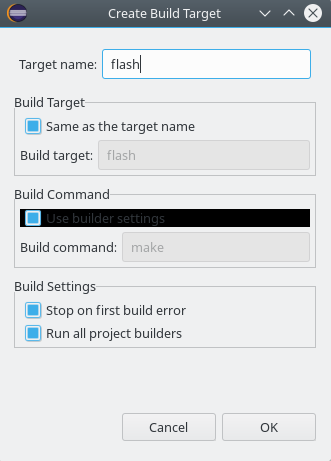
eclipse-create-targetEnter flash as value in the target name field, leaving everything else as default

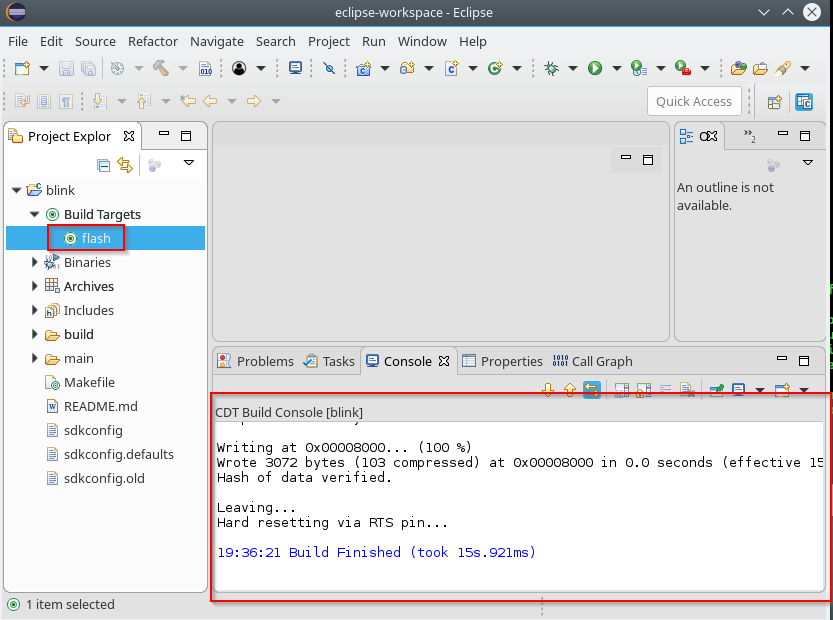
eclipse-create-target-flashAt this point we proceed to upload the image by double-clicking on the new flash item within the project targets

eclipse-run-flashThe settings to run the flash must be set with make menuconfig, as seen in the previous article